Figure 3.
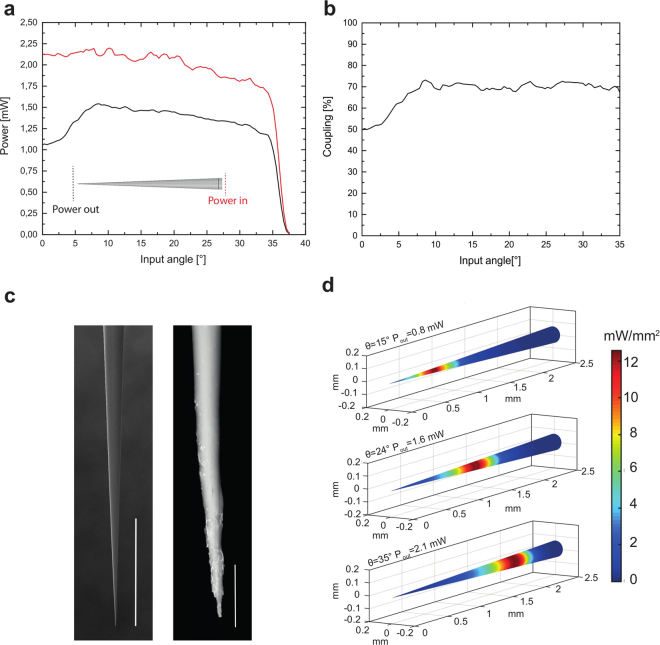
Characterization of light coupling efficiency and output power density for NA = 0.66 TFs. (a) Light coupling across the NA = 0.66 angular acceptance. The input power (red line) was measured at the entrance of the tapered region. The output power (black line) was measures in close proximity to the taper tip, as shown in the inset. A drop in power output was observed for low input angles. (b) Power coupling efficiency, calculated as the ratio between output and input power, versus light input angle. The coupling efficiency is approximately constant for θin > 10°. (c) Scanning electron microscope images of a NA 0.66 TF. While the left panel shows a homogeneous portion of the taper region, scale bar 400 µm, the close-up in the right panel shows degradation of the taper surface in proximity of the tip, scale bar is 20 µm. (d) The three panels show the distribution of power density on the taper surface when 12 mW/mm2 are emitted for three input angles, namely θin = 15°, 24°, 35°. As light is out-coupled from a wider region when the input angle increases, the input power has to be varied accordingly to maintain a constant output power density.

