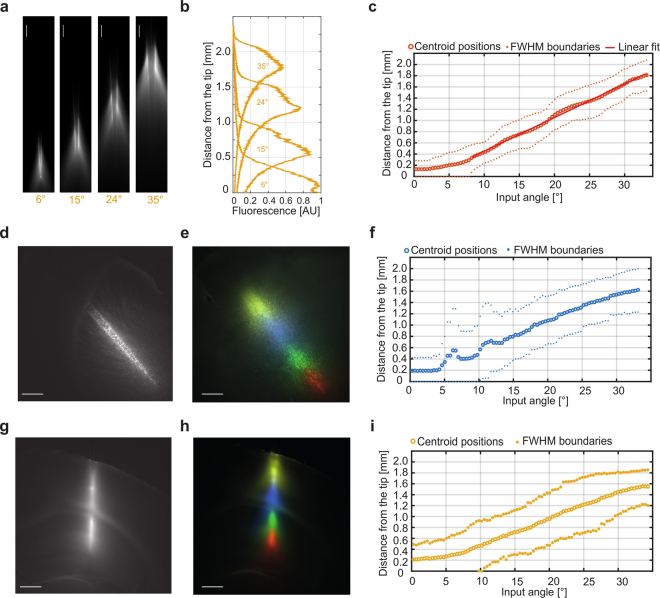
Figure 4.
High NA TFs: light delivery at 561 nm and in brain tissue. (a) Spatially selective light delivery observed for a NA = 0.66, 200 µm core size fiber injected with 561 nm light and submerged in a PBS-eosin solution. Scale bars are 200 µm (b) Emission profiles measure along the taper surface for the input angles shown in panel (a). (c) Position of the intensity centroid of the emission region (orange circles) and positions of the FWHM values of the emission region (pale orange dots) with respect to the input angle. The red line indicates a linear fit on the centroid position. (d) Large volume illumination obtained by injecting 473 nm light over the fiber full NA once inserted in mouse striatum; scale bar is 500 µm. (e) False color overlay of adjacent regions illuminated with spatially selective light delivery at 473 nm, scale bar is 500 µm. (f) Position of the intensity centroid of the emission region (blue circles) and positions of the FWHM values of the emission region (pale blue dots) with respect to the input angle. (g) Large volume illumination obtained by injecting 561 nm light over the fiber full NA once inserted in mouse cortex and hippocampus; scale bar is 500 µm. (h) False color overlay of adjacent regions illuminated with spatially selective light delivery at 561 nm, scale bar is 500 µm. (g) Position of the intensity centroid of the emission region (yellow circles) and positions of the FWHM values of the emission region (yellow dots) with respect to the input angle.

