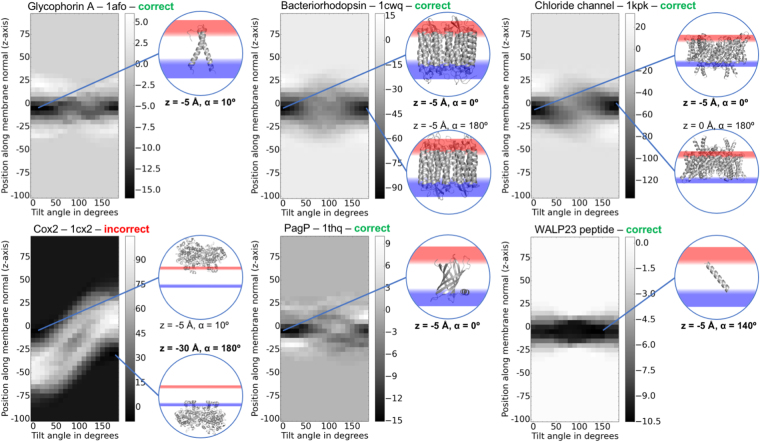
Figure 7.
Energy profiles for different depths and tilt angles inside and outside the membrane. The native position at (0, 0) is the protein embedding from PDBTM with the topology from the OPM database. Note that at this position, the protein can already be tilted with respect to the membrane normal. The protein tilt angles at the native position are the following: Glycophorin A = 11.7°, Bacteriorhodopsin = 0°, Chloride channel = 10.7°, Cox2 = NA, PagP = 29.0°, WALP23 = 1.6°. Low energy conformations are shown in the pictures with membrane planes in red being the outer leaflet and blue being the inner leaflet. z-axis and tilt angles are shown for the low energy conformations; the lowest energy embedding parameters for the predicted topologies are highlighted in bold. Correct predictions are highlighted in green, the incorrect one (Cox2) in red.

