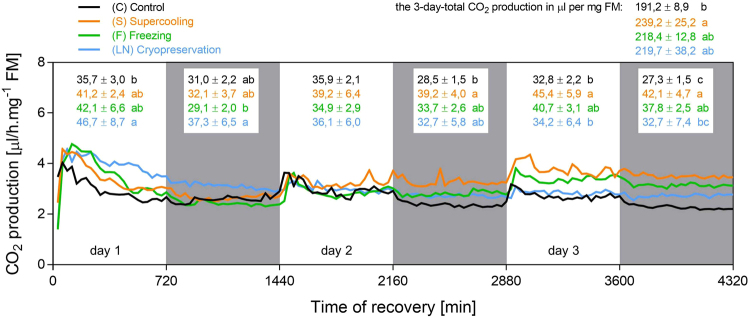
Figure 2.
CO2 production in control and cold-stressed Chymomyza costata larvae. Each line represents a mean record of CO2 production analyzed in six groups of ten larvae. The record was taken in 30 min intervals during three days (4,320 min) of recovery at 18 °C from different cold stresses (S, F, LN, see Fig. 1 and text for more details). The control larvae (C) were not subjected to cold stress but were transferred from 4 °C directly to 18 °C. White and grey areas represent alteration of light and dark conditions (12 h L, 12 h D). The numbers show mean ± S.D. CO2 production is expressed in µl per mg fresh mass (FM) for each experimental variant (color coded) during 12 h intervals and also during the whole three day period (means flanked by different letters are statistically different according to ANOVA followed by Bonferroni’s test). See Dataset S1 for more details.

