Figure 4.

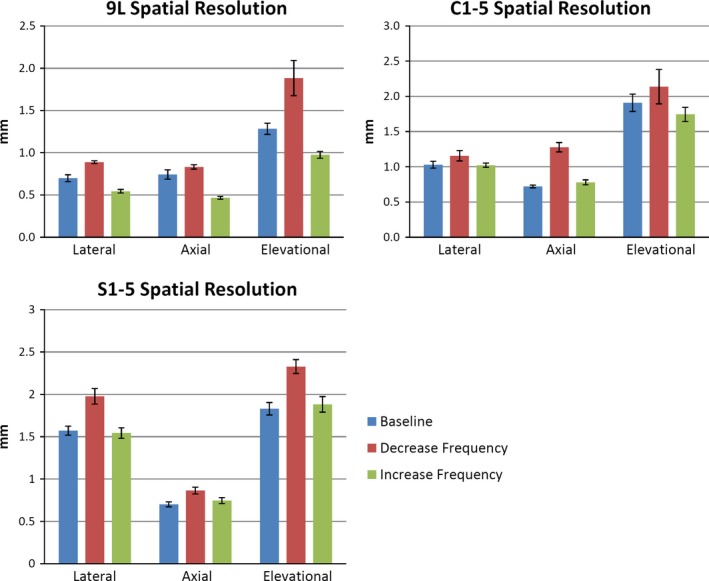
Sensitivity results for spatial resolution measured with 9L, C1‐5, and S1‐5 transducers. Specific frequency values are detailed in Table 3. Mean and standard deviation were obtained from six sets of images.

Sensitivity results for spatial resolution measured with 9L, C1‐5, and S1‐5 transducers. Specific frequency values are detailed in Table 3. Mean and standard deviation were obtained from six sets of images.