
Figure 5.
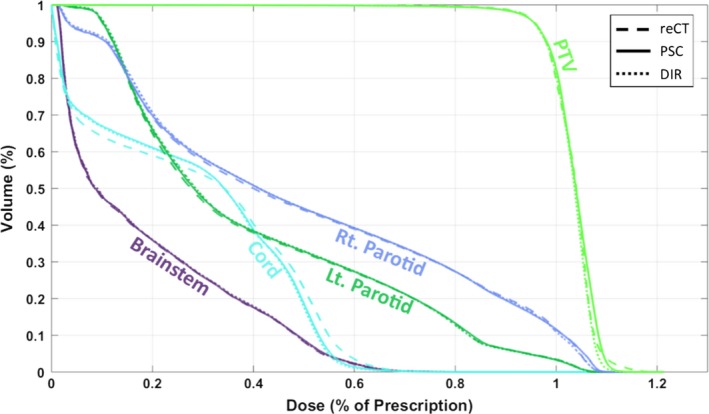
Average dose‐volume histograms of fifteen plans, calculated with the gold‐standard reCT image set (dashed line), and the CBCT calibrated with the patient‐specific calibrated method (PSC, solid line), and the DIR method (DIR, dotted line).
Official websites use .gov
A
.gov website belongs to an official
government organization in the United States.
Secure .gov websites use HTTPS
A lock (
) or https:// means you've safely
connected to the .gov website. Share sensitive
information only on official, secure websites.
Average dose‐volume histograms of fifteen plans, calculated with the gold‐standard reCT image set (dashed line), and the CBCT calibrated with the patient‐specific calibrated method (PSC, solid line), and the DIR method (DIR, dotted line).