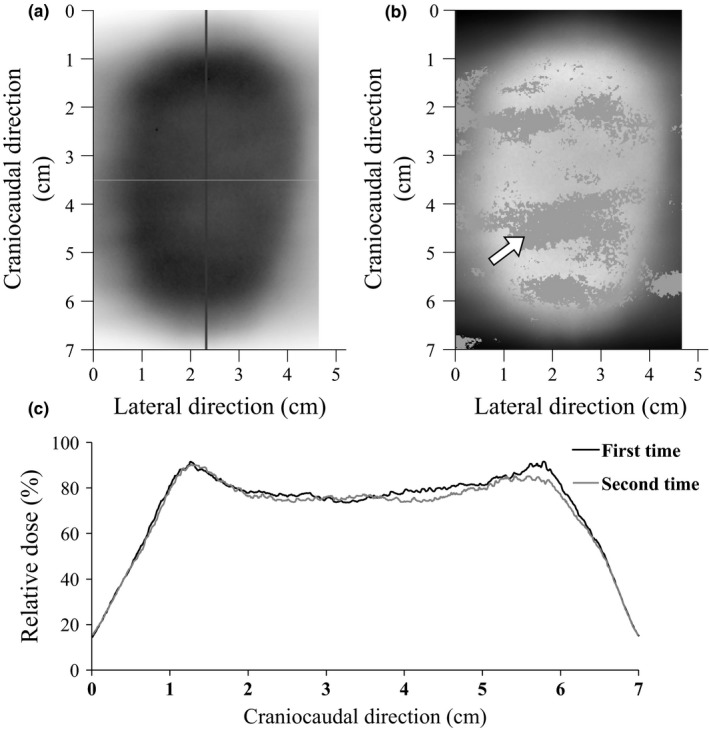
Figure 2.

Comparison between measured dose distributions in patient number 3. (a) film image, (b) result of γ evaluation method (tolerance values; 2%/2 mm, threshold 30%), (c) dose profiles in craniocaudal direction through the isocenter. Film measurements were performed twice for each patient. The dose distributions were obtained during irradiation while moving the phantom with the patient's respiration waveform and amplitude along craniocaudal direction. Measurements were repeated two times with random starting phases of the breathing cycle. In the γ evaluation method, the area with a γ value >1 appears in gray. The white arrow shows the point of the maximum dose difference (10.4%). In the dose profile, the black solid line indicates the first measurement, and the gray solid line indicates the second measurement.
