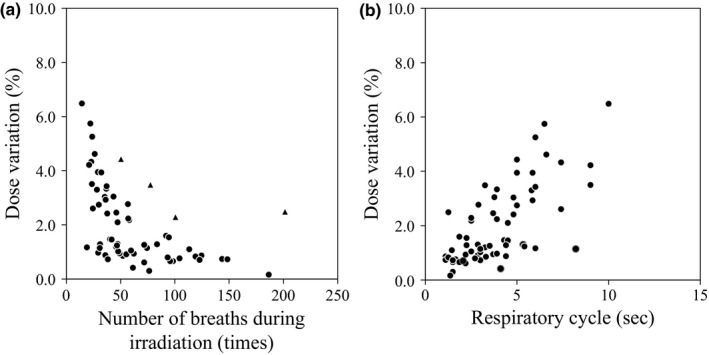
Figure 3.

Dose variation measured with different number of breaths in the same plan. (a) Dose variation vs. number of breaths during irradiation. Closed circles show results of patient number 1–9 and 11–16. Closed triangles show the result of patient number 10. (b) Dose variation vs. time of a single respiratory cycle. Dose variations were obtained from dose measurements 10 times with the micro chamber.
