
Fig. 1.
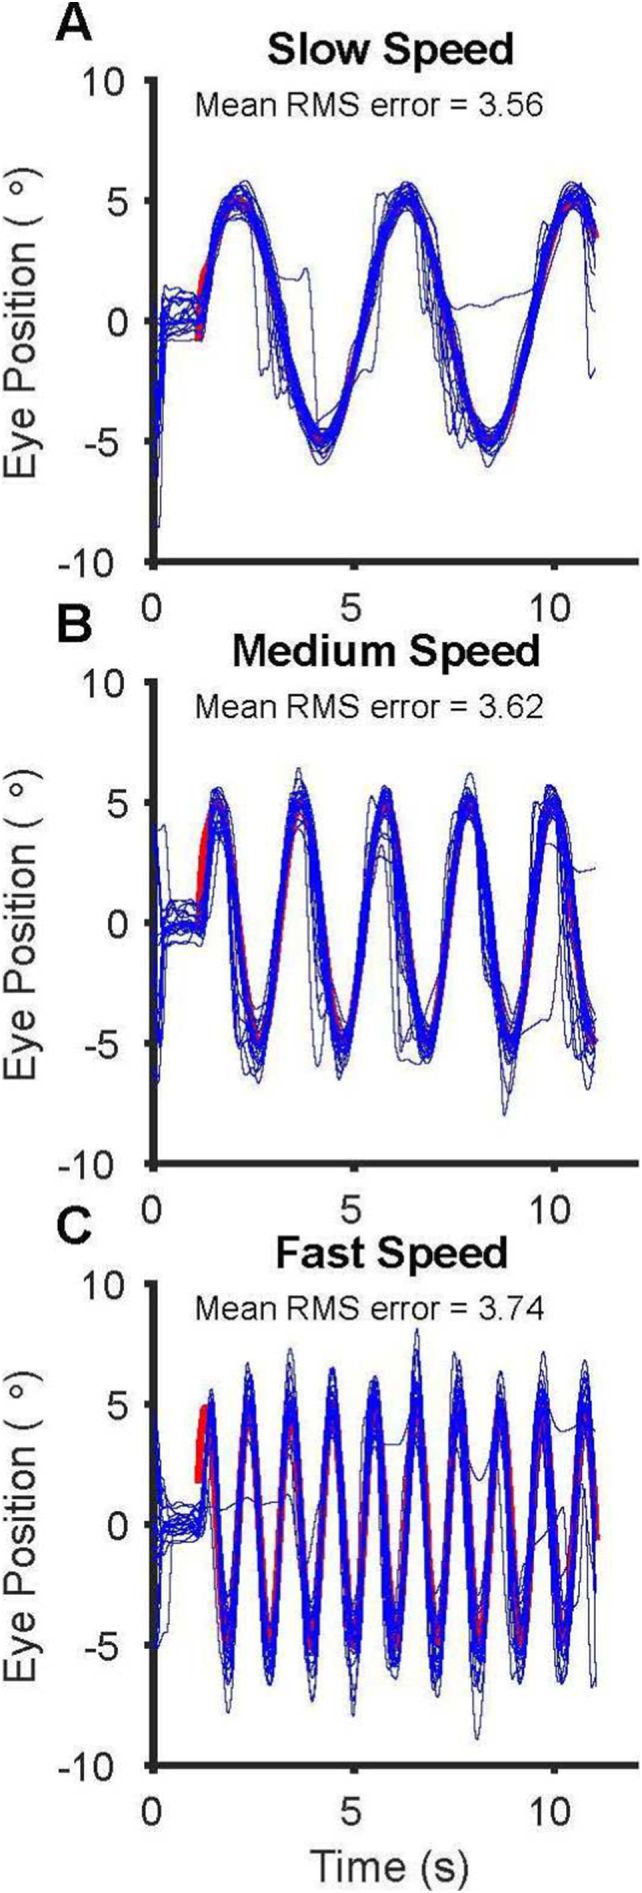
Example subject ocular-motor performance for the slow (A), medium (B), and fast stimulus conditions (C). The red trace underneath is the horizontal position of the stimulus and the blue traces are all 20° horizontal eye movement records. The mean RMS error for all 20 trials and for each stimulus condition is listed in the figure. (For interpretation of the references to color in this figure legend, the reader is referred to the web version of this article.)