Figure 6.

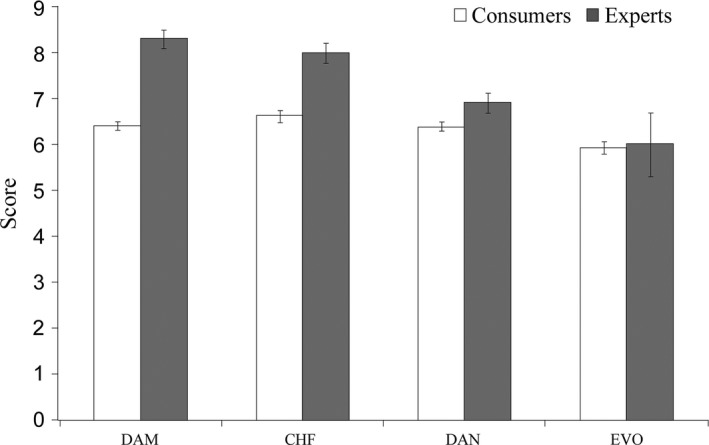
Bar plot comparing consumers and experts overall level of likeability expressed for each cocoa bar. The small bars represent the standard error of the mean

Bar plot comparing consumers and experts overall level of likeability expressed for each cocoa bar. The small bars represent the standard error of the mean