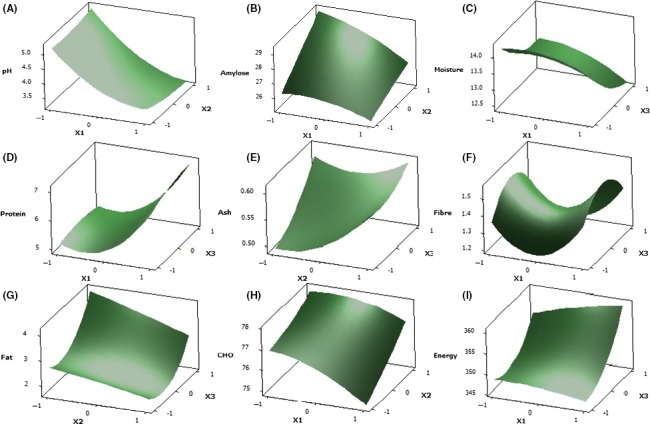
Figure 3.

Surface plots of the responses investigated (A)Y 1—pH, (B)Y 2—amylose content, (C)Y 3—moisture content, (D)Y 4—protein content, (E)Y 5—ash content, (F) Y 6—crude fiber, (G)Y 7—fat content, (H)Y 8—carbohydrate content, and (I)Y 9—total energy
