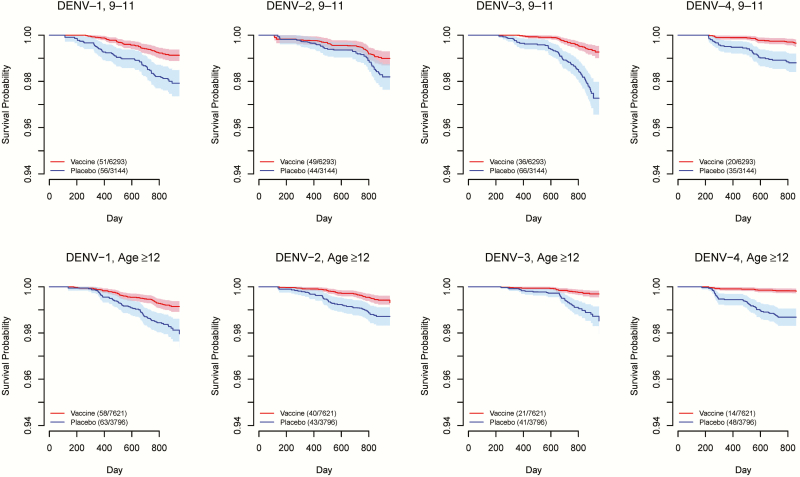
Figure 3.
Fleming-Harrington survival curves for time to virologically confirmed dengue symptoms in the vaccine arm (red) and the placebo arm (blue) of CYD15, stratified by dengue virus (DENV) serotype and age group. Solid lines represent mean survival curves over 50 imputed data sets of unobserved baseline immunity status. Shaded areas are 95% confidence interval bands. Key shows number of events/number of study subjects in each arm.

