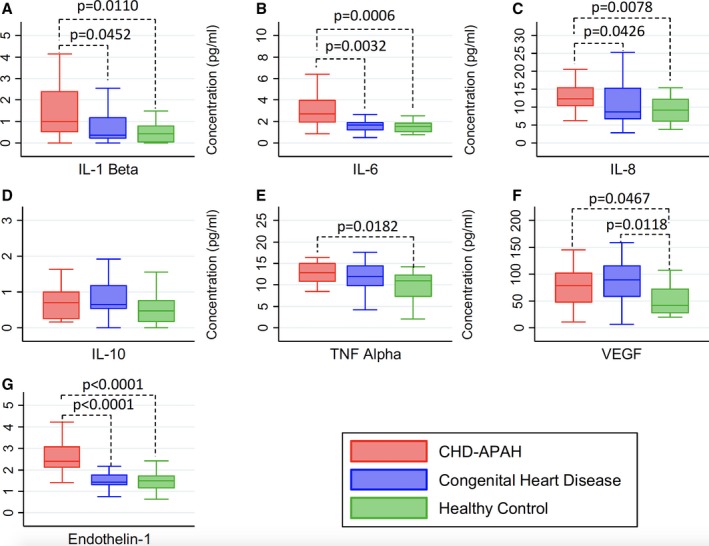
Figure 1.

Serum cytokines (pg/mL) by group. Data displayed as box and whisker plots of median, interquartile range, and minimum and maximum values. For cytokine concentrations with a statistically significant difference between groups (P<0.05 Kruskal–Wallis), the P value is indicated (Dunn's). A, IL‐1β (P=0.0214 Kruskal–Wallis), (B) IL‐6 (P=0.0005 Kruskal–Wallis), (C) IL‐8 (P=0.0161 Kruskal–Wallis), (D) IL‐10 (P=0.1119 Kruskal–Wallis), (E) TNFα (P=0.0411 Kruskal–Wallis), (F) VEGF (P=0.0232 Kruskal–Wallis) and (G) endothelin‐1 (P=0.0001 Kruskal–Wallis). IL indicates interleukin; TNFα, tumor necrosis factor α; VEGF, vascular endothelial growth factor.
