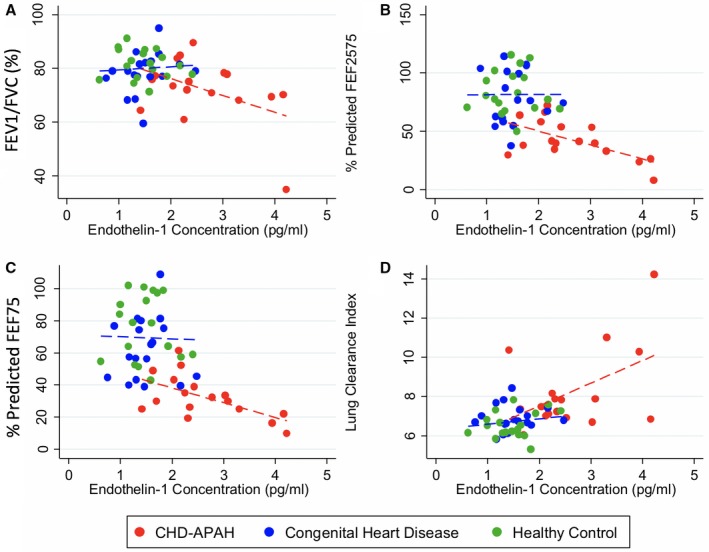
Figure 3.

Serum endothelin‐1 and lung function. A, FEV 1/FVC ratio. Linear regression for CHD‐APAH r 2=0.2032, P=0.0693 (red dotted line) and CHD and healthy controls combined r 2=0.0054, P=0.6714 (blue dotted line); (B) Percent predicted FEF25‐75. Linear regression for CHD‐APAH r 2=0.3733, P=0.0092 (red dotted line) and CHD and healthy controls combined r 2=0.0000, P=0.9912 (blue dotted line); (C) Percent predicted FEF75. Linear regression for CHD‐APAH r 2=0.3500, P=0.0124 (red dotted line) and CHD and healthy controls combined r 2=0.0008, P=0.8733 (blue dotted line); (D) Lung clearance index. Linear regression for CHD‐APAH r 2=0.2307, P=0.0510 (red dotted line) and CHD and healthy controls combined r 2=0.0308, P=0.3062 (blue dotted line). CHD‐APAH indicates congenital heart disease–associated pulmonary artery hypertension; FEF 25/50/75, forced expiratory flow at 25/50/75% of FVC; FEV 1, forced expiratory volume in 1 second; FVC, forced vital capacity.
