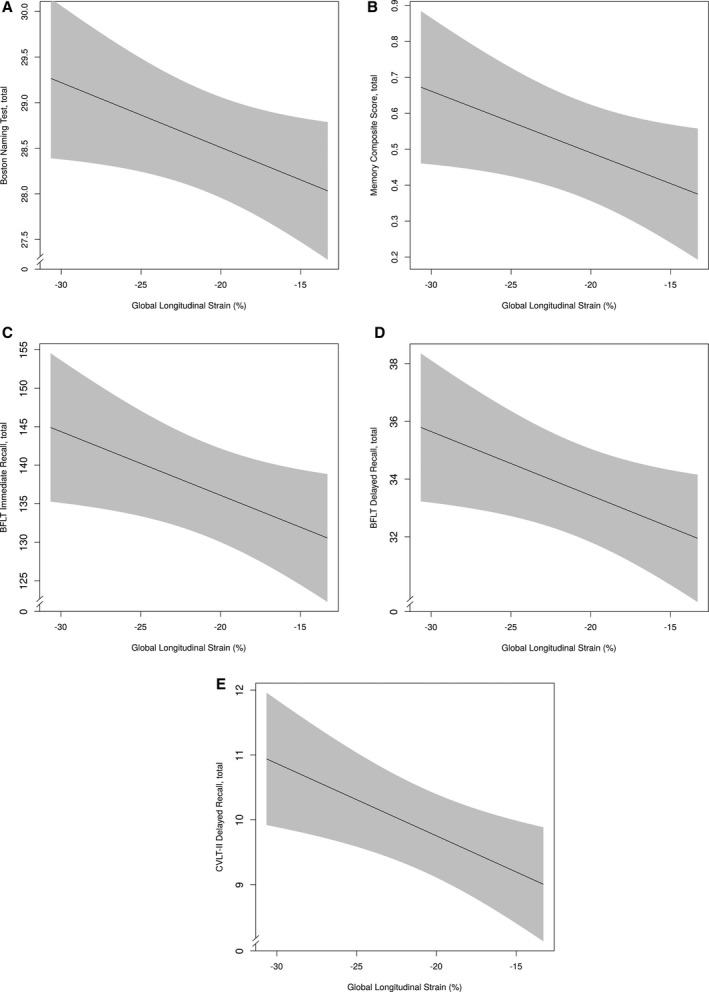
Figure 2.

GLS and neuropsychological outcomes. Solid black line reflects fitted (predicted) values of cognitive outcomes (y‐axis) corresponding to cardiac strain (x‐axis) for a given participant profile (using prevalent level for categorical variables and median for continuous variables). Shading reflects 95% confidence interval. A, GLS and Boston Naming Test. B, GLS and memory composite. C, GLS and BFLT Immediate Recall, total. D, GLS and BFLT Delayed Recall, total. E, GLS and CVLT‐II Delayed Recall, total. BFLT indicates Biber Figure Learning Test; CVLT‐II, California Verbal Learning Test, Second Edition; GLS, global longitudinal strain.
