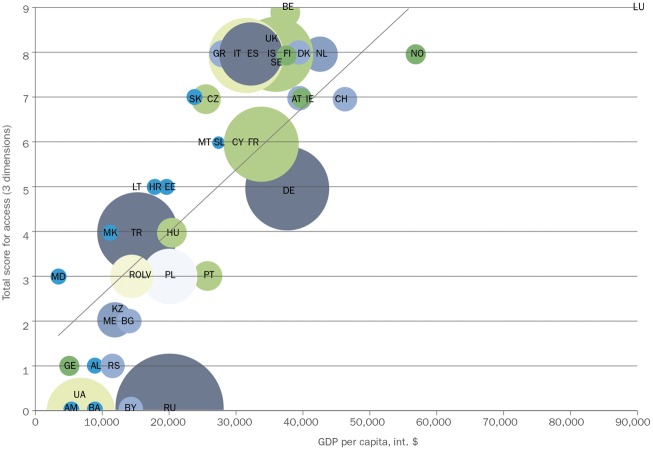
Fig. 3.
Access to biologic DMARDs according to gross domestic product per capita
Analysis based on GDP in dollars in 44 countries. The size of the bubbles is proportional to the population size of the country. Reproduced from: Putrik P, Ramiro S, Kvien TK et al. Inequalities in access to biological and synthetic DMARDs across 46 European Countries. Ann Rheum Dis 2014;73:198–206, © 2014 [3]. With permission from BMJ Publishing Group Ltd. AL: Albania; AM: Armenia; AT: Austria; BA: Bosnia and Herzegovina; bDMARD: biologic DMARD; BE: Belgium; BG: Bulgaria; BY: Belarus; CH: Switzerland; CY: Cyprus; CZ: Czech Republic; DE: Germany; DK: Denmark; EE: Estonia; ES: Spain; FI: Finland; FR: France; GDP: gross domestic product; GE: Georgia; GR: Greece; HR: Croatia; HU: Hungary; IE: Ireland; IS: Iceland; IT: Italy; KZ: Kazakhstan; LT: Lithuania; LU: Luxembourg; LV: Latvia; MD: Moldova; ME: Montenegro; MK: Macedonia; MT: Malta; NL: The Netherlands; NO: Norway; PL: Poland; PT: Portugal; RO: Romania; RS: Serbia; RU: Russia; SE: Sweden; SK: Slovakia; SL: Slovenia; TR: Turkey; UA: Ukraine; UK: United Kingdom.

