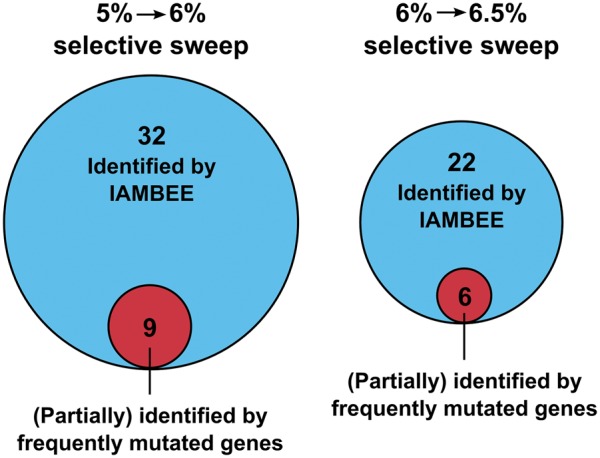
Fig. 7.

Comparison of the output generated by IAMBEE with the per gene mutation frequency approach. By performing a pooled analysis of the mutation data observed in the 16 populations during the first and second selective sweep IAMBEE identified, respectively, 32 and 22 connected network components. The alternative method using exclusively the number of mutations per gene allowed (partial) identification of 9 and 6 connected network components in the first and second selective sweep, respectively. This result clearly demonstrates that only a fraction of the involved adaptive pathways are identified by using the approach that only takes into account frequently mutated genes. By combining mutation frequency data and functional impact scores, IAMBEE enables identification of the network components underlying an adaptive phenotype. More details on the specific connected network components prioritized by both approaches are given in supplementary table 1 and figures 6 and 7, Supplementary Material online.
