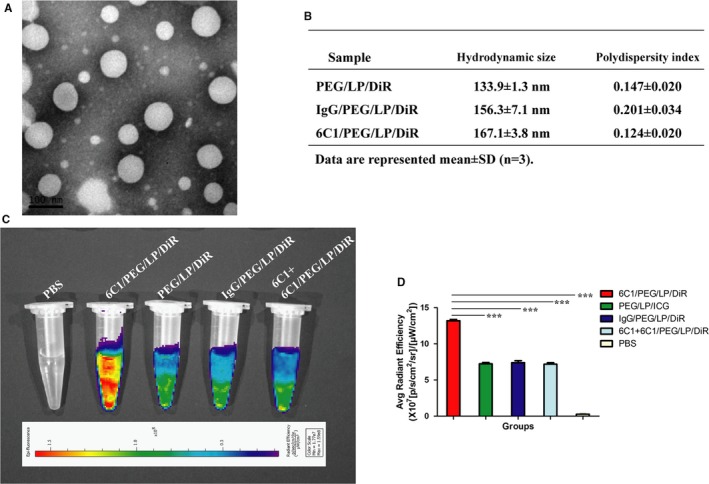
Figure 3.

A, Transmission electron microscopy image of 6C1/PEG/LP/DiR. B, Hydrodynamic size and polydispersity index of PEG/LP/DiR, IgG/PEG/LP/DiR, and 6C1/PEG/LP/DiR were determined by dynamic light scattering. C, Representative near‐infrared fluorescence (NIRF) images of spleen cells in different groups showed a remarkable fluorescence signal in the 6C1/PEG/LP/DiR group, which indicated a higher cellular binding efficacy of 6C1/PEG/LP/DiR compared with the control nanoprobes in cells. D, Quantitative data of (C) is shown (n=3): ***P<0.01. PEG indicates polyethylene glycol.
