
Figure 1.
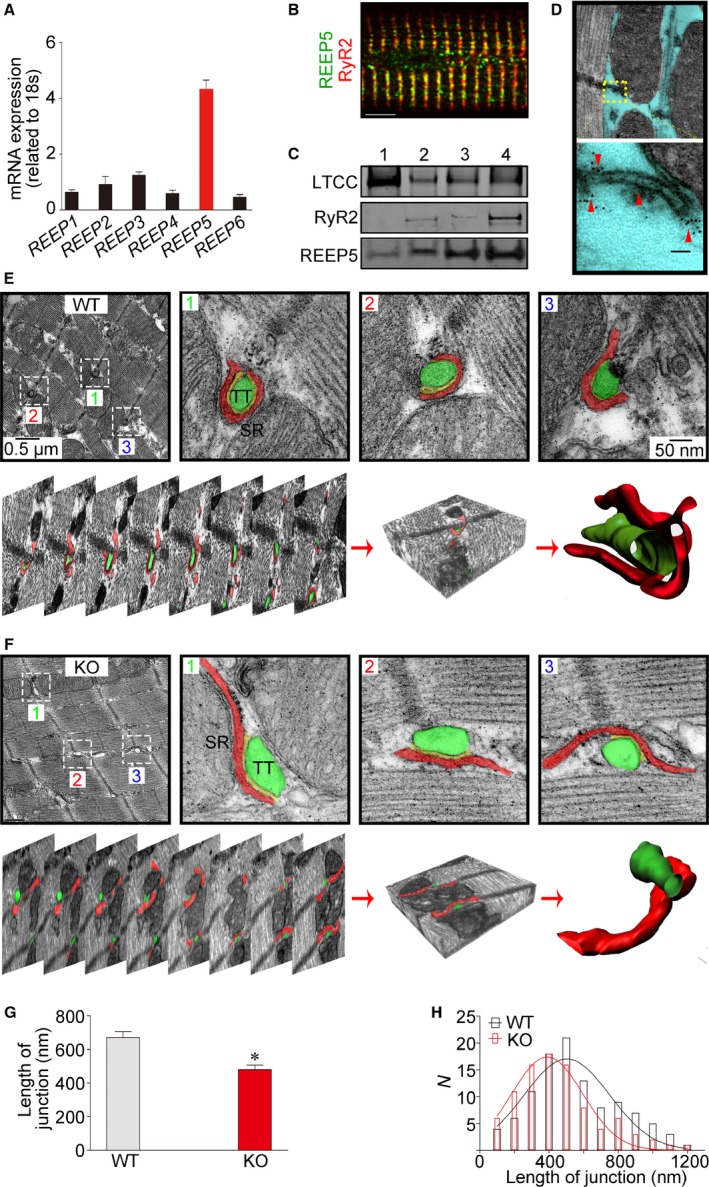
REEP5 mediates membrane shaping of the cardiac SR. A, Quantitative polymerase chain reaction measurements of REEP1 through REEP6 levels in adult rat ventricular myocardium. B, Immunofluorescence imaging of REEP5 in isolated intact adult rat ventricular myocytes. Scale bar: 5 μm. C, Identification of REEP5 proteins in sucrose gradient centrifugation–based membrane fractions. Numbers 1 to 4 indicate <23%, 23% to 29%, 29% to 32%, and 32% to 35% sucrose contents, respectively. D, Two‐dimensional transmission EM images of normal heart sections immunolabeled for REEP5. The yellow box identifies the SR structure, and the red arrowheads denote the REEP5 proteins situated on the SR. E and F, Three‐dimensional reconstruction of SR from serial EM images of WT and REEP5‐KO heart sections. The top panels in (E) and (F) show EM images of axial cross‐sections of heart tissue, and the bottom panels present serial aligned images from the same section. Bottom right shows digitized 3D reconstruction of the SR with an associated t‐tubule from the serial images. The green regions indicate t‐tubules, and the red regions indicate the SR. G and H, The apparent length of SR/t‐tubule junction (G) and its distribution (H). Data are from 90 (WT) and 108 (REEP5‐KO) SR/t‐tubule junction images in 3 independent experiments per group. *P<0.05 compared with WT controls. The blots and images shown are representative of 3 to 5 independent experiments. EM indicates electron microscopy; KO, knockout; LTCC, L‐type Ca2+ channel; REEP, receptor accessory protein; RyR2, ryanodine receptor 2; SR, sarcoplasmic reticulum; t‐tubule, transverse tubule; WT, wild type.