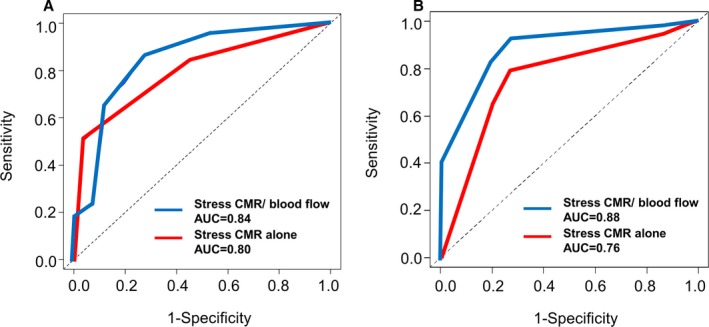
Figure 6.

Comparison of the receiver operating characteristic (ROC) curves. ROC curve and corresponding area under the curve (AUC) describing the diagnostic concordance of stress‐rest perfusion cardiovascular magnetic resonance (CMR) alone (red line) and combined assessment of stress‐rest perfusion CMR and blood flow in the coronary sinus (blue line) to identify flow‐limiting stenosis at vessel level (A) and patient level (B).
