Fig. 2.
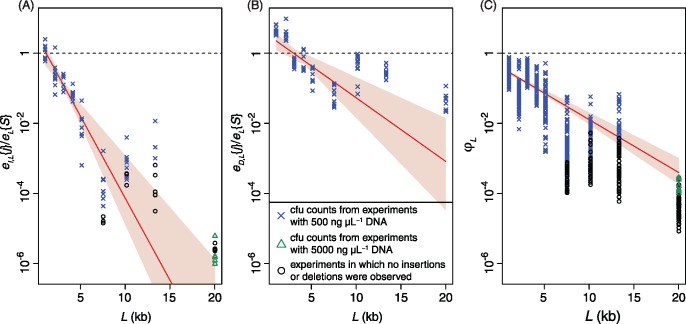
Rates of polymorphism transfer through transformation. (A) Relationship between heterologous locus length, L, and rate of insertion, eI,L{j}, relative to rate of SNP acquisition, eL{S}. Each point represents a biological replicate. Blue crosses and green triangles represent eI,L{j} estimates from counting colonies following transformation with 500 ng, or 5,000 ng, donor DNA, respectively; black circles represent experiments where eI,L{j} was too low to be experimentally detectable following transformation, hence a value of eI,L{j} = 0.5 cfu ml−1 was assumed for display purposes. The red line displays the best fitting relationship of the form τI(1−λI)L. The pink shaded region indicates the full range of associated uncertainty inferred from 100 bootstrap replicates. The horizontal dashed line indicates where eI,L{j} equals eL{S}. (B) Relationship between heterologous locus length, L, and rate of deletion, eD,L{j}, relative to rate of SNP acquisition, eL{S}. Results are displayed as in panel (A). (C) Asymmetry of transformation, ϕL. The points represent every ratio of eI,L{j}/eL{S} to eD,L{j}/eL{S} for each L. The characters correspond to those of the underlying eI,L{j}/eL{S} value in panel (A); eI,L{j} values of zero are again substituted for 0.5 cfu ml−1. The red line and pink shaded region display the best-fitting relationship of the form ϕ0(1−λϕ)L, and the associated uncertainty inferred from 100 bootstrap replicates.

