Fig. 1.
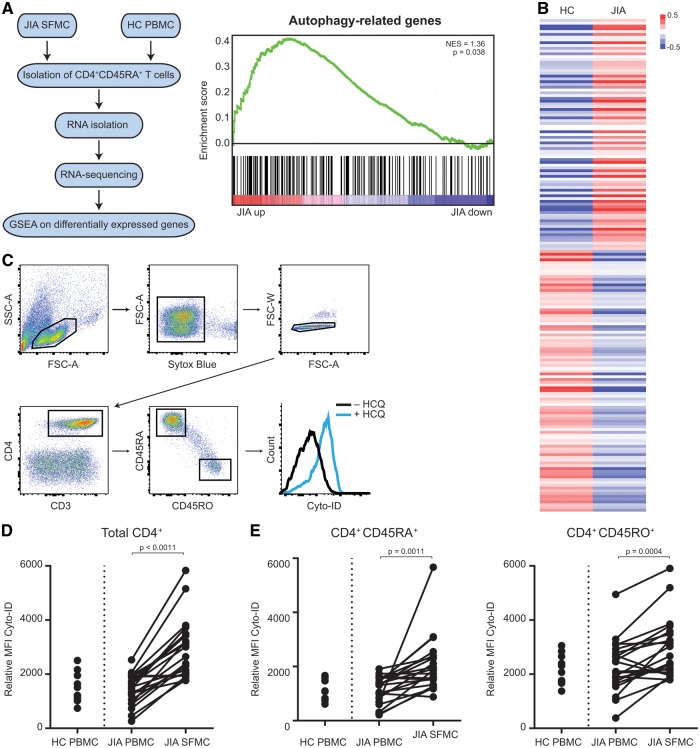
Autophagy is increased in JIA SF-derived CD4+ T cells compared with JIA peripheral blood-derived T cells
(A) Schematic overview of experimental set-up of RNA sequencing. (B) Gene Set Enrichment Analysis of autophagy-related genes. (C) Average log2 fold change of autophagy-related genes in HC and JIA CD4+CD45RO+ T cells. (D) Gating strategy used to analyse autophagy levels in CD4+ T cells. (E) Relative MFI Cyto-ID of CD4+ T cells in HC PBMC (n = 11), JIA PBMC and SFMC (n = 21, paired) cultured for 16 h with or without 20 µM HCQ. (F) Relative MFI Cyto-ID of CD4+CD45RA+ and CD4+CD45RO+ T cells in HC PBMC, JIA PBMC and SFMC cultured with or without 20 µM HCQ. HC: healthy controls; MFI: mean fluorescence intensity; PBMC: peripheral blood mononuclear cells; SFMC: SF mononuclear cells.

