Fig. 6.
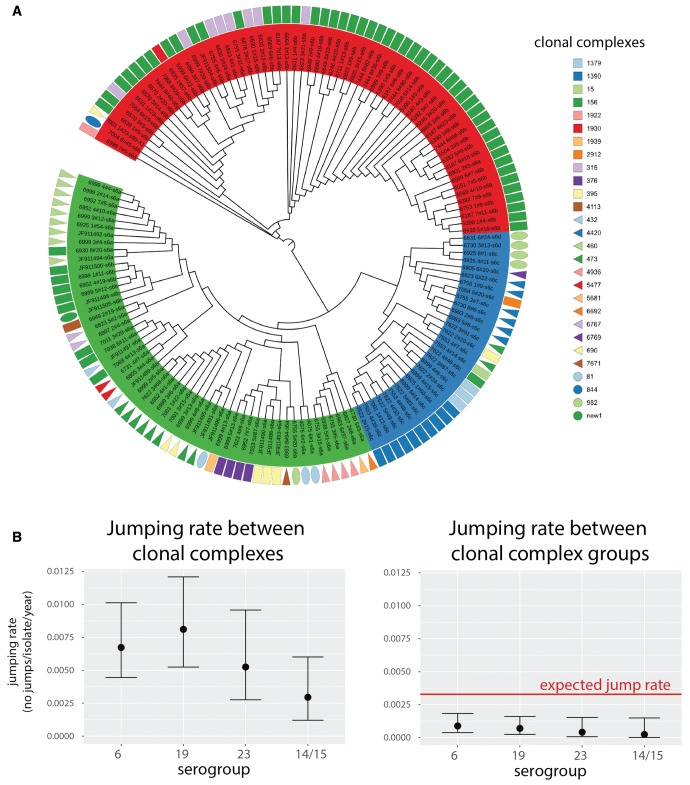
Lineage-jumping dynamics. (A) Dendogram based on the phylogeny of serogroup 6. Tips are grouped according to the three major populations identified: class-I 6A clade (green), 6C/6D clade (blue) and class-II 6B clade (red). Geometric shapes aligned with the tips denote the corresponding clonal complexes of the strains in which the serotype sequence was found. The clades of the tree with branch lengths shorter than 9 × 10⁻⁵ were collapsed and the most frequent lineage within the clade was plotted. (B) Lineage-jumping rates inferred for the four most frequent serogroups (6, 19, 23 and 14/15) with lineages defined as clonal complexes (CC; left) and as clonal complex groups (CCG; right). The red line shows the CCG jumping rate expected based on the observed CC jumping rate and the assumption that changes between all pairs of CC are equally likely. Mean estimate and the 95% of the highest posterior density is shown.

