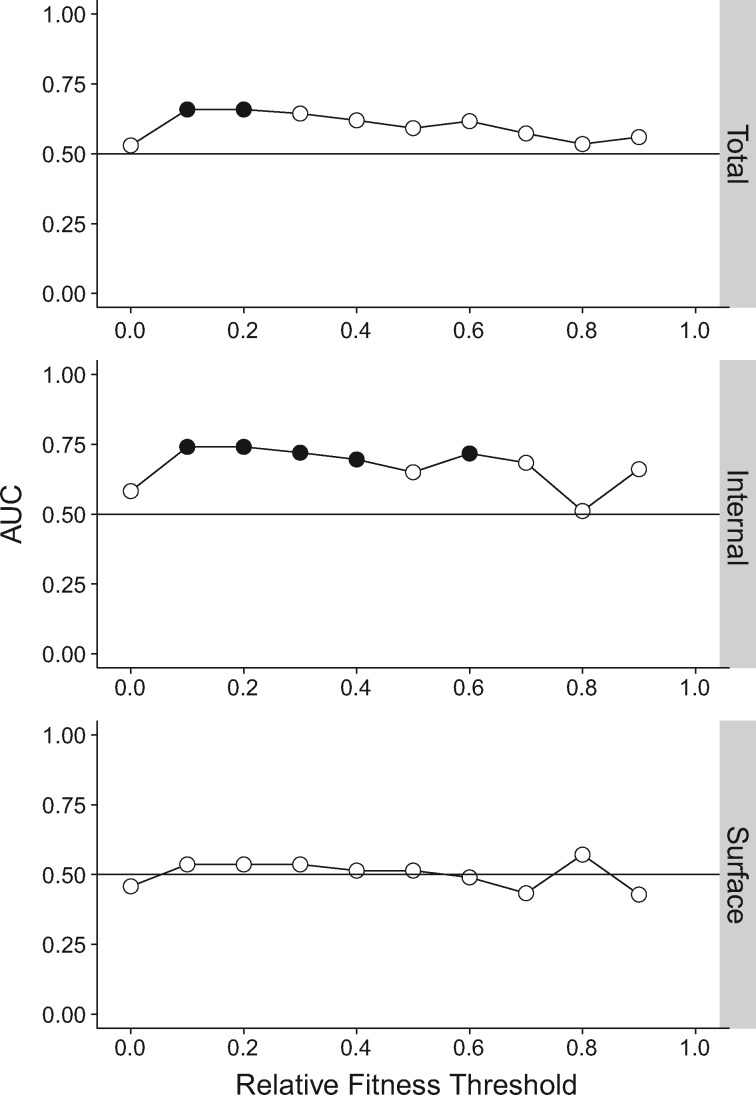
Fig. 1.
Differences in Ts and Tv fitness effects as measured by AUC. Transition–transversion (Ts–Tv) fitness differences as measured by area under the curve of an ROC curve (AUC) for the total, internal, and surface influenza data sets. To identify the points along the fitness distribution at which there is a Ts–Tv difference, the AUC was calculated among mutations at or above 10 successively higher fitness thresholds, starting at 0 and increasing by 0.10. Filled circles denote P<0.05 for a one-sided Mann–Whitney U test where the alternative is transitions are more fit at that threshold. Lines shown to clarify trends only. Plotted data and raw P values can be found at https://github.com/lauringlab/tstv_paper, last accessed September 26, 2017.

