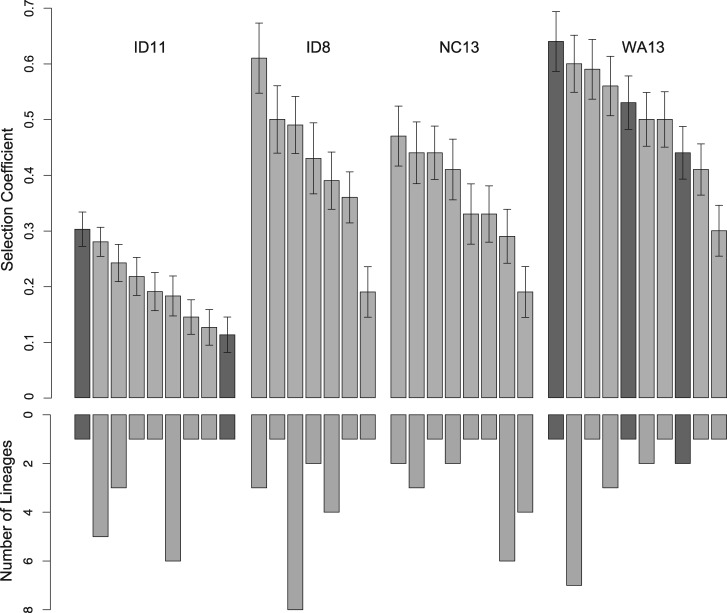
Fig. 3.
Selection coefficients (s) for each of the unique mutations to fix in the 20 replicates of each genotype, and the number of lineages in which they occurred. Dark gray indicates substitutions resulting in transversions and light gray indicates transitions. For all four genotypes, the most fit mutation was never the most frequent. For NC13, half of all lineages fixed one of the two lowest fitness mutations.

