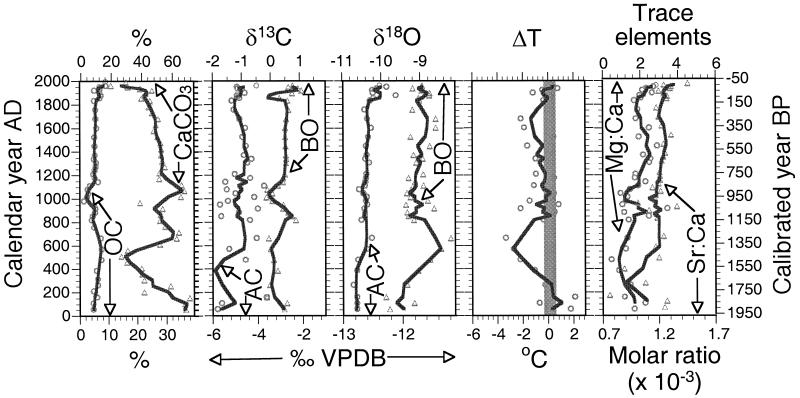
Figure 3.
Climate records for the past 2000 years. These records include gross sediment composition, carbon and oxygen isotopic values, growing-season temperature anomalies, and trace-element ratios. OC, organic carbon; CaCO3, carbonate as calculated from inorganic carbon content; AC, abiotic carbonate (bulk carbonate excluding shells of ostracodes, bivalves, and gastropods); BO, valves of benthic ostracode C. ikpikpukensis; ΔT, growing-season temperature anomaly; VPDB, Vienna Peedee belemnite. The vertical bar in the ΔT plot marks the temperature range of the 20th century, as represented by the uppermost three samples. Open symbols are original data, and lines are three-point moving averages to emphasize overall trends. Calibrated year B.P. is referenced to the year 1950.

