Fig. 1.
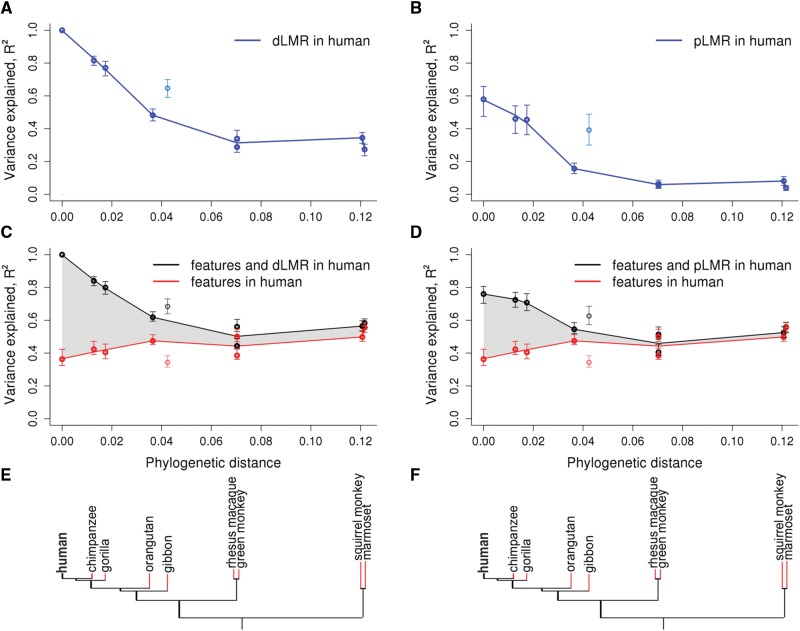
LMR variation in primate species explained by genomic features and LMR in the human lineage. (A–D) For each primate species, the fraction of the explained variance in LMR (R2, vertical axis) is plotted against the phylogenetic distance from human (horizontal axis). The values for the gibbon, which has a high rate of rearrangements (Carbone et al. 2014), are plotted, but were not included in the fit. Variance in dLMR explained by the human dLMR (A) or pLMR (B). Variance in dLMR explained by human genomic features alone (red) or in combination with the human dLMR (C) or pLMR (D; black). The following features were included in the model: GC-content, recombination rate, number of exonic nucleotides, replication timing, number of DHSs, densities of H3K27ac, H3K27me3, and H3K9me3 histone marks and MAF. The shaded area represents the inferred fraction of the variance in non-human LMR explainable by the human LMR independently of the genomic features. Error bars correspond to 95% CIs obtained by bootstrapping. (E, F) Phylogenetic tree of the considered species. Red color denotes branches for which the LMR was calculated.

