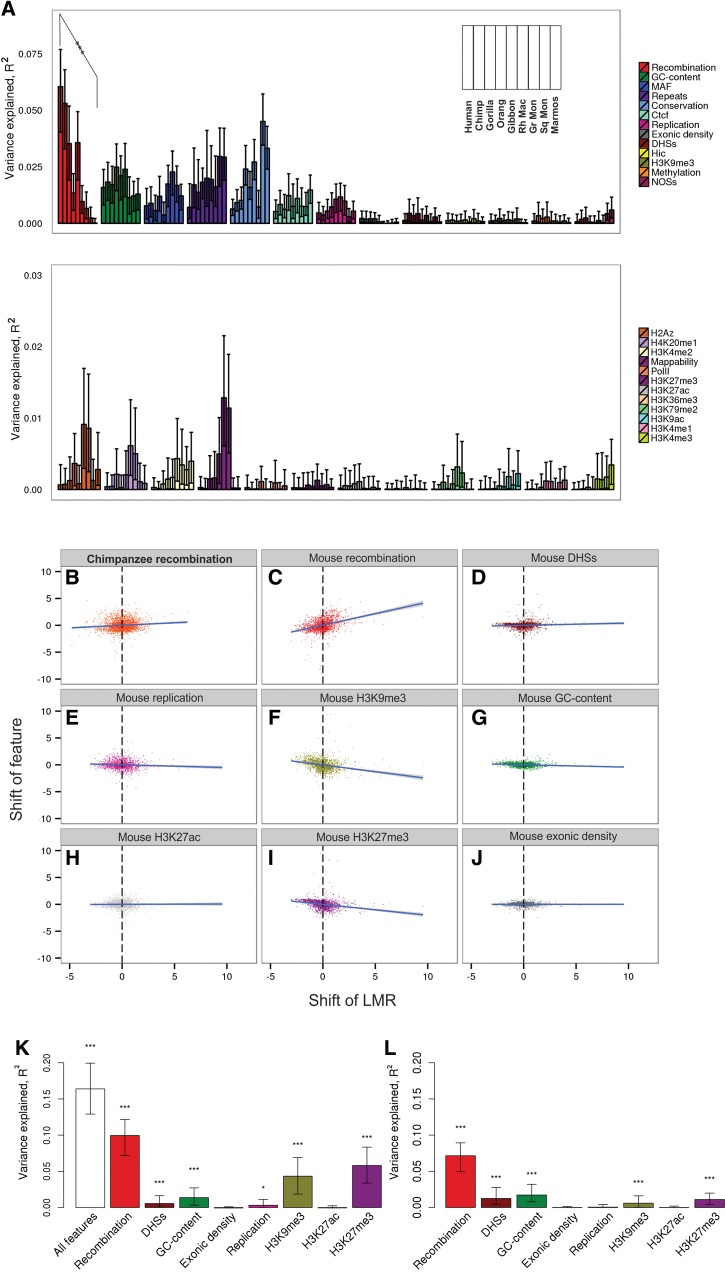
Fig. 2.
LMR explained by individual genomic features. (A) Variance of the LMR explained by the 25 genomic features. For each genomic feature, the fraction of the variance explained by this feature in ANOVA type III analysis is shown for each primate at increasing phylogenetic distances from human. The inset shows the order of the species along the horizontal axis (same as in fig. 1). The features are ordered by the fraction of the variance explained in human (note the different scale of the vertical axis). The asterisks indicate the significance of the negative correlation between the R2 and the phylogenetic distance. (B–J) Scatterplots for raw correlations of the changes in the LMR and in select genomic features between human and mouse lineages. Each dot corresponds to a 1 Mb window. (K–L) Changes in the LMR explained by the changes in select genomic features between human and mouse. Vertical axis, fraction of variance in differences in LMRs explainable by differences in genomic features between human and mouse. Columns correspond to the variance explained by features measured by R2 (K) or ANOVA type III analysis (L). Error bars correspond to 95% CIs obtained by bootstrapping. Asterisks indicate the significance of the deviation of the regression line from 0 (*P < 0.05, **P < 0.01, ***P < 0.001).

