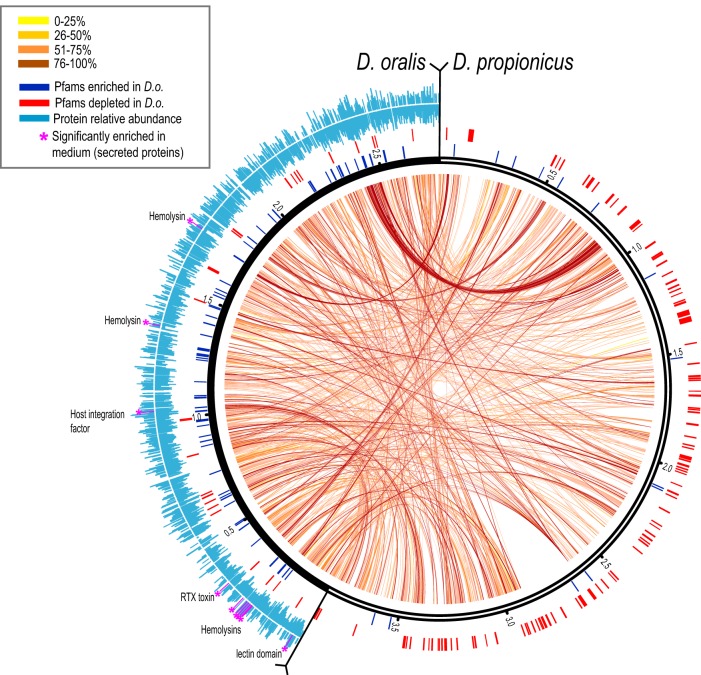
FIG 4 .
Genomic comparison of D. oralis and D. propionicus. Matching orthologs are connected by internal arc lines, the color scale indicating the degree of pairwise sequence identity at the protein level. External tick lines indicate genes in each genome that contain protein domains enriched (blue) or depleted (red) in D. oralis (based on data in Data Set S2). The outer histograms (light blue) indicate the relative abundance of each detected protein in D. oralis cells (bottom) or culture medium (top). Secreted proteins significantly enriched in the medium are identified and indicated by purple asterisks and lines.

