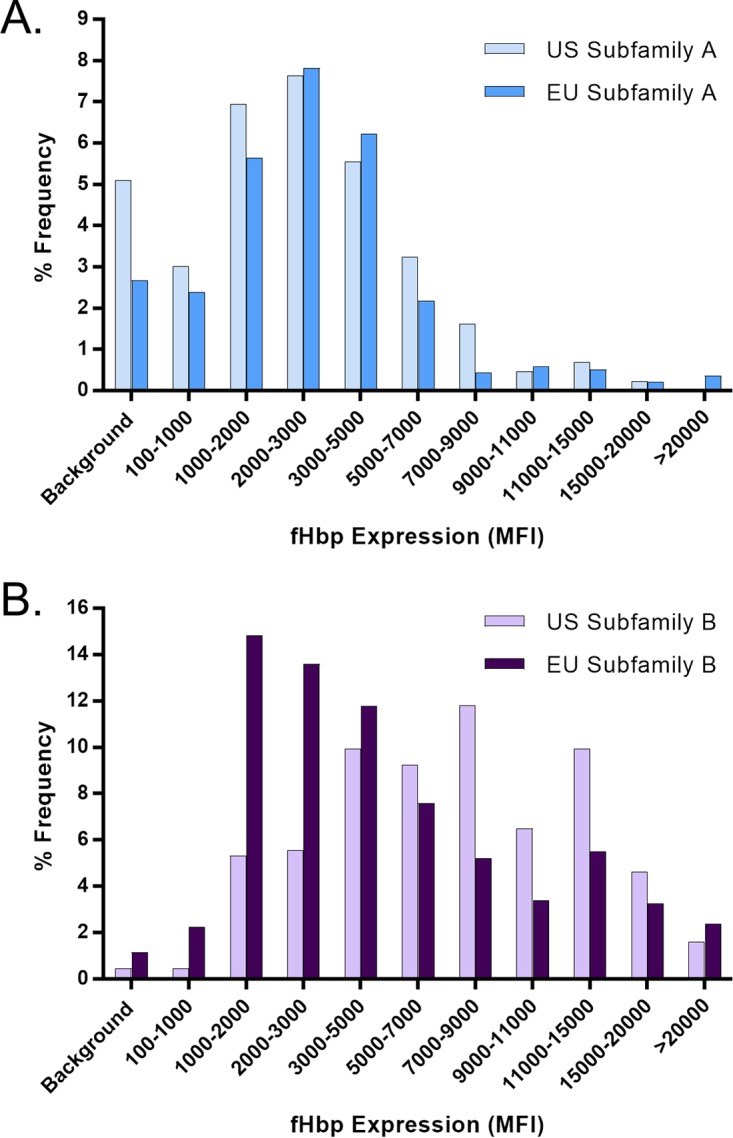
FIG 5 .

fHBP expression levels are distributed similarly in European Union (EU) and United States isolates. fHBP surface expression levels in the United States (n = 432) and European Union (n = 1,382) subsets of the prevalence-based collection of invasive NmB isolates (n = 1,814) are shown. (A) Subfamily A isolates from the United States (n = 149) and the European Union (n = 401). (B) Subfamily B isolates from the United States (n = 283) and the European Union (n = 981). Isolates were binned on the basis of their level of fHBP expression (MFI) in the MEASURE assay. The y axis represents the frequency of isolates in each binned group. Background denotes an MFI of <3 times the mouse IgG (negative control) MFI and/or an MFI of <100.
