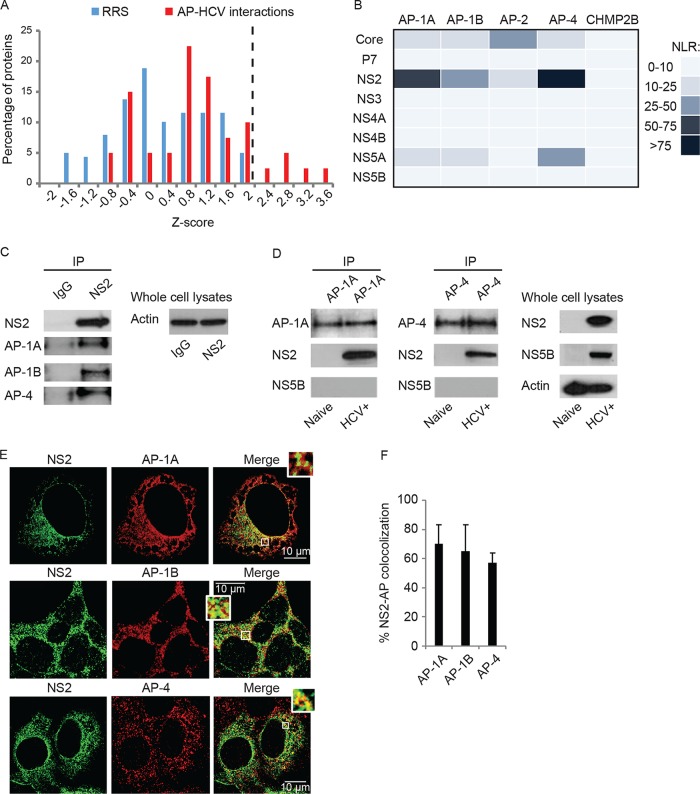
FIG 1 .
Interactions between HCV proteins and host APs. (A) Results of PCA screening for interactions of AP μ subunits with individual HCV proteins. Histogram of the mean z scores of the set studied and RRS of interactions obtained from three independent experiments. The dotted line defines the cutoff used for positive interactions. (B) Heat map of the interactions color coded on the basis of the NLR. (C) NS2 interacts with APs in HCV RNA-transfected cells. Immunoprecipitations (IPs) from membrane fractions of HCV RNA-transfected or naive Huh7.5 cells with anti-NS2 (C), anti-AP-1A, or anti-AP-4 (D) antibodies and IgG controls (C). Antibodies used for immunoblotting are indicated on the left. (E) Representative confocal IF microscopy images at ×40 magnification of AP (red) and NS2 (green) in HCV-transfected cells. Scale bars represent 10 µm. (F) Quantitative colocalization analysis of z stacks by using Manders’ colocalization coefficients. Mean M2 values are presented as percent colocalization (the fraction of green intensity that coincides with red intensity) ± SD.

