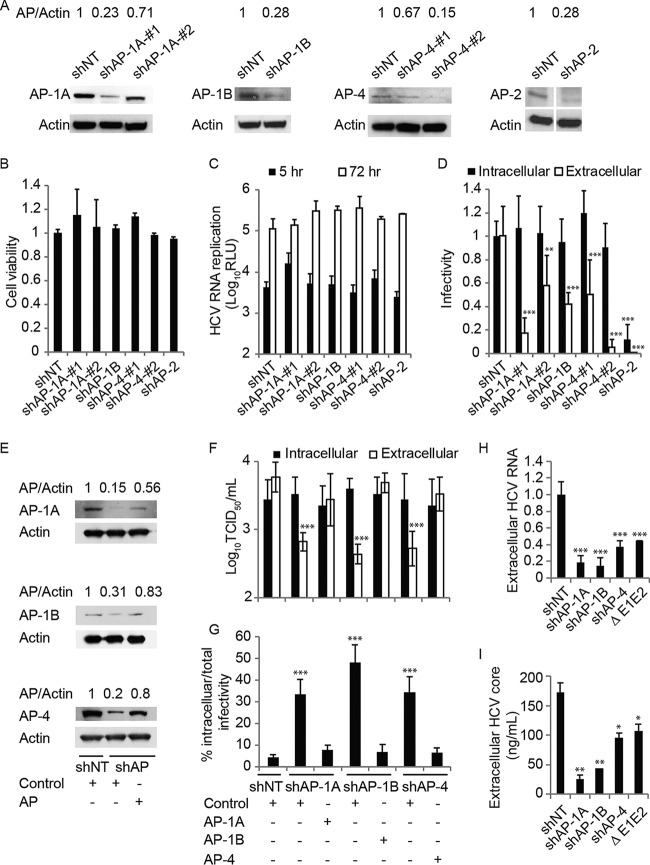
FIG 3 .
AP-1A/B and AP-4 mediate HCV release. (A) Confirmation of gene expression knockdown by Western blotting in Huh7.5 cells stably expressing AP shRNA or an NT control (values are AP-to-actin protein ratios relative to the NT control). (B) Relative cell viability in these cell lines measured by alamarBlue assays. (C) HCV RNA replication measured via luciferase assays 5 and 72 h after HCV RNA electroporation. RLU, relative light units. (D) HCV infectivity measured via luciferase assay by inoculating naive cells with lysates (intracellular) and supernatants (extracellular) from electroporated cells. (E to G) Levels of APs by Western blot analysis (E), intra- and extracellular viral titers measured by limiting-dilution assays (F), and intracellular infectivity as a percentage of the total infectivity (G) in cells concurrently transduced with shAP-1A, shAP-1B, and shAP-4 and transfected with the respective shRNA-resistant AP cDNA or an empty control plasmid. (H and I) Viral RNA (H) and core protein (I) release into the culture supernatant at 72 h postelectroporation measured by qRT-PCR and ELISA, respectively. Data are plotted relative to NT control values. Results in panels C, D, and F to I represent data pooled from three independent experiments each with three to six biological replicates. Shown are the mean ± SD. *, P < 0.05; **, P < 0.01; ***, P < 0.001 (relative to the corresponding NT control; one-way [B, D, and F to I] or two-way [C] ANOVA with Dunnett’s [C, D, H, and I] or Tukey’s [F and G] post hoc test).

