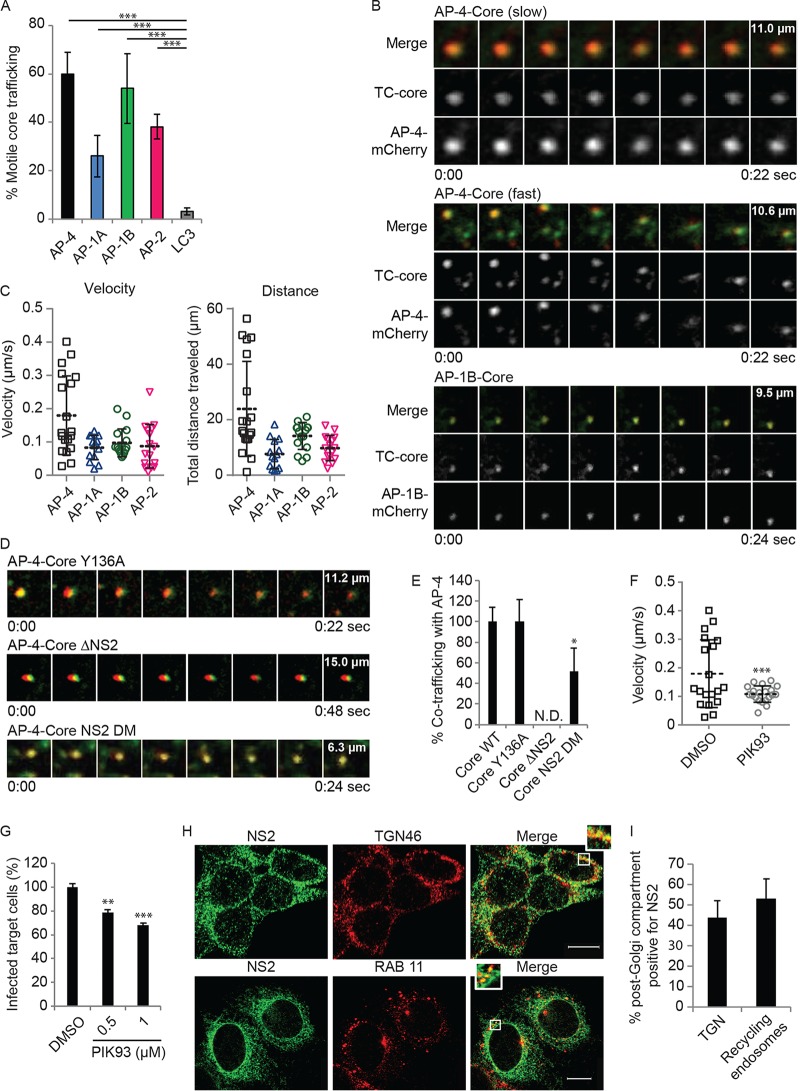
FIG 5 .
HCV particles cotraffic with AP-4 in a post-TGN compartment. (A) Quantification of motile TC-core puncta cotrafficking with AP-4, AP-1A, AP-1B, AP-2, and LC3. (B) Representative live-cell fluorescence microscopy montages of TC-core HCV (green) cotrafficking with AP-4-mCherry (top and panels middle) or AP-1B-meCherry (bottom) (red). The time elapsed (seconds) during video acquisition and the vertical dimension of the crop (micrometers) are indicated. (C) Velocity (left) and total distance traveled (right) of individual TC-core puncta cotrafficking with AP-4, AP-1A, AP-1B, or AP-2. (D and E) Representative montages (D) and quantitative data relative to WT TC-core (E) from live cell fluorescence microscopy of AP-4 cotrafficking with Y136A (top), NS2 deletion (middle), and NS2 double dileucine (DM; bottom) TC-core mutants. (F) Quantification of velocity per acquisition of WT TC-Core associated with AP-4 upon treatment with PIK93. (G) HCV cell-to-cell spread measured by FACS analysis following a 6-h treatment of cocultures of HCV RNA-transfected Huh7.5 donor cells and GFP-expressing target cells with PIK93. (H) Representative confocal IF microscopy images at ×40 magnification of NS2 (green) and TGN46 (red) or RAB11 (red) in HCV-transfected cells. n = >25. Scale bars represent 10 µm. (I) Quantitative colocalization analysis of z stacks by using Manders’ colocalization coefficients. Mean M2 values are represented as percent colocalization (the fraction of green intensity that coincides with red intensity ± SD). N.D., not detected. Experiments were replicated at least twice. *, P < 0.05; **, P < 0.01; ***, P < 0.001 (one-way ANOVA with Dunnett’s post hoc test [A, E, and G] or two-tailed unpaired t test [F]).

