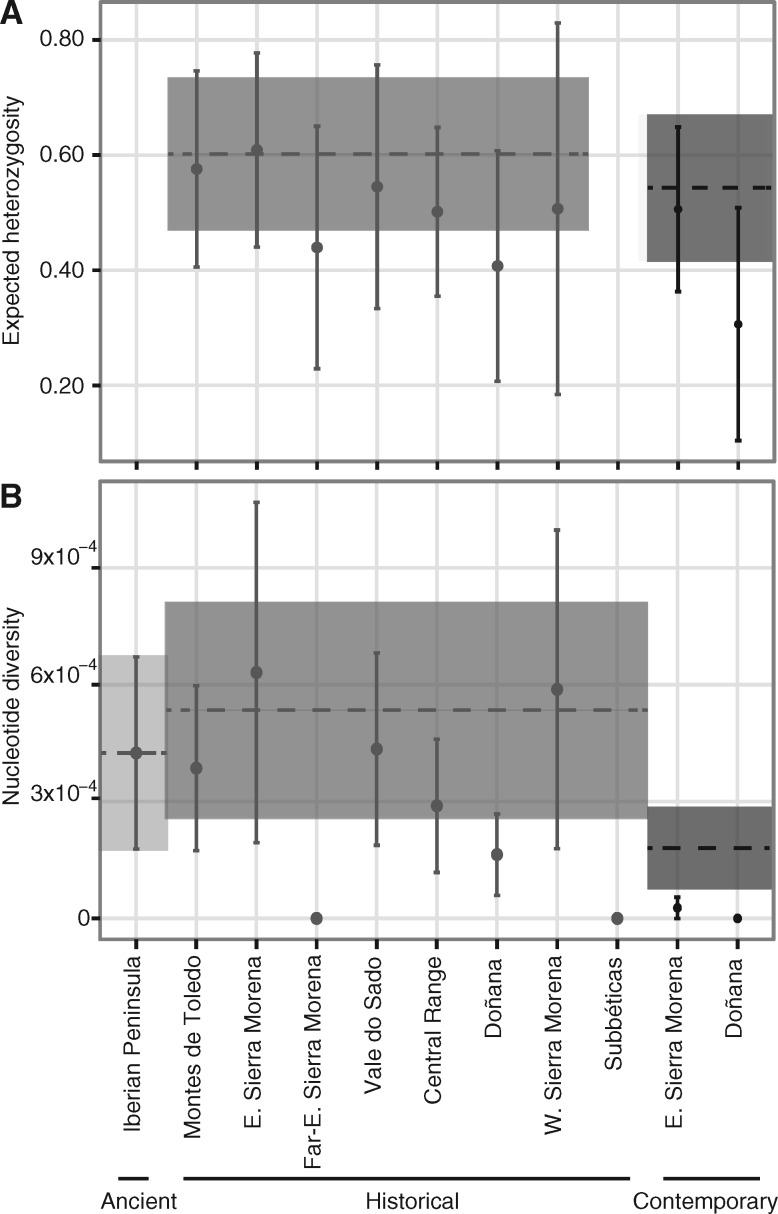
Fig. 5.
Comparison of genetic diversity across periods. Microsatellite diversity was quantified as the unbiased expected heterozygosity (A), and whole mitochondrial diversity as nucleotide diversity (B). Points represent the average and standard error for each population, whereas the horizontal dashed lines and the corresponding shaded interval represent the same for the pooled samples of each period. Periods are color-coded in shades of grey. See tables 1 and 2 for other diversity and differentiation measures.

