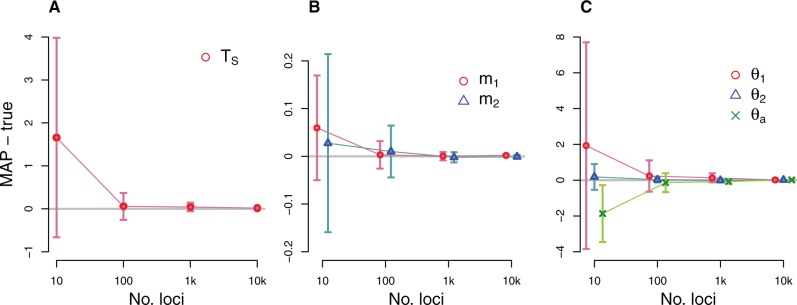
Fig. 3.
Simulation results illustrating the performance of the new method for a 2-population IM model. The true IM model has parameters TS = 2, and . DNA sequences were simulated over a range of loci numbers. For each plot, the x axis for numbers of loci is on a log scale. The difference between the true value and the mean of the estimated values are plotted (gray horizontal line at 0), and vertical dashed lines indicate standard errors. The average of MAP estimations from 20 replicates, each with 1,000 coalescent trees per locus sampled in step 1, are compared with the true parameters. (a) The average difference between MAP estimates and the true splitting time. (b) The average differences for migration parameters. (c) The average differences for the population size parameters for sampled and ancestral populations.

