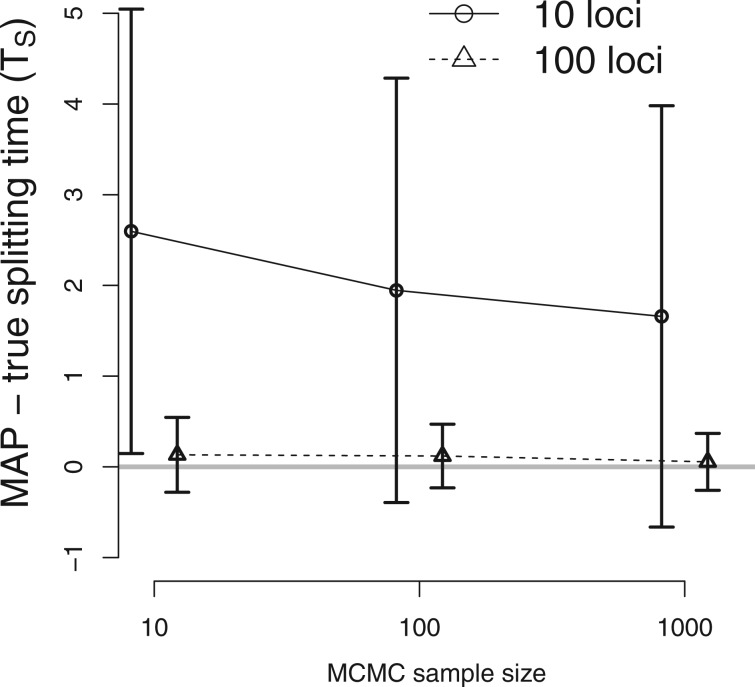
Fig. 5.
The performance of the new method as a function of MCMC sample size. The true IM model has parameters TS = 2, , and . The difference between the true splitting time and the mean of the estimated values are plotted (gray horizontal line at 0), and vertical lines indicate standard errors. DNA sequences were simulated for 10 loci ( and real line) and 100 loci ( and dashed line). The x axis for MCMC sample size is on a log scale. The estimates of other parameters are shown on supplementary figure S3, Supplementary Material online.

