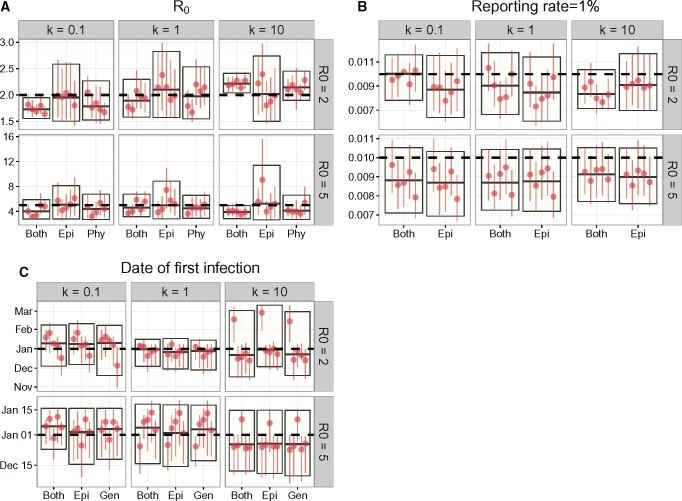
Fig. 2.
Parameter estimates when reporting rate was 1 in 100 and k was fixed to 1. The horizontal dashed lines denote the true parameter value for that set of parameters that is, the parameter value used to simulate the data. The boxes indicate the median and 95% HPD interval of parameter estimates pooled from replicate simulations. The vertical lines with a single dot denote the median and 95% HPD interval of each individual simulation. Simulations where the MCMC chain did not converge were left out of the plot. Estimates of the reporting rate did not include inference from phylogenetic data, as the reporting rate refers to the probability that an infection appears in the incidence time series.

