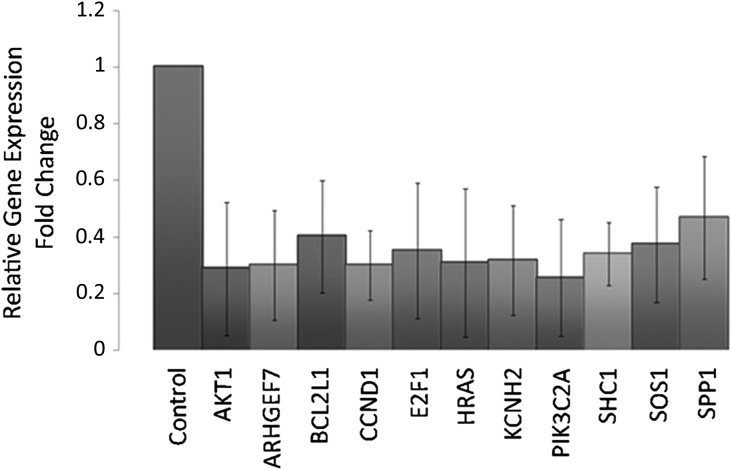
Figure 2.
Genes down-regulated in CCs associated with positive versus negative outcome. Bar charts show the 11 transcripts down-expressed in CCs associated with positive outcome versus negative outcome (control) ± SD. Raw data were analysed by DataAssist software under global normalization using GAPDH, 18 s and GUSB as selected internal controls. A gene was considered differentially expressed in positive CCs versus negative CCs when showing a fold change >1.4 or <0.7 and a P-value < 0.05 (ANOVA). P-values were adjusted using Benjamini–Hochberg FDR correction.

