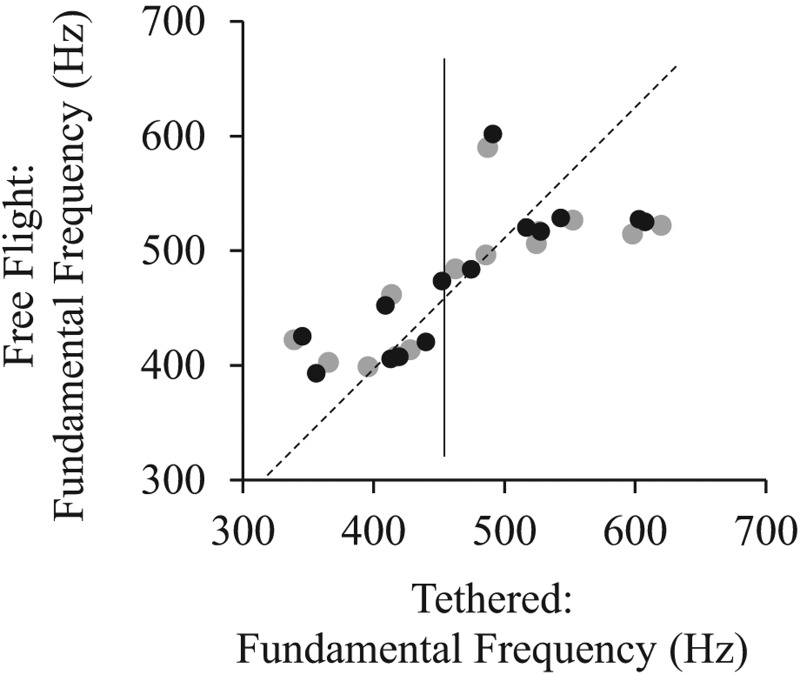
Fig. 5.
Tethered versus free-flying female Ae. aegypti fundamental frequency. Each dot indicates a pair of recordings from free flight or tethered individuals or groups. A perfect one-to-one relationship would fall on the dotted line. The solid line separates the points between the two temperatures (left: 18 °C; right: 32 °C). Black dots—unadjusted pairs; Gray dots—pairs adjusted for minor differences in temperature.

