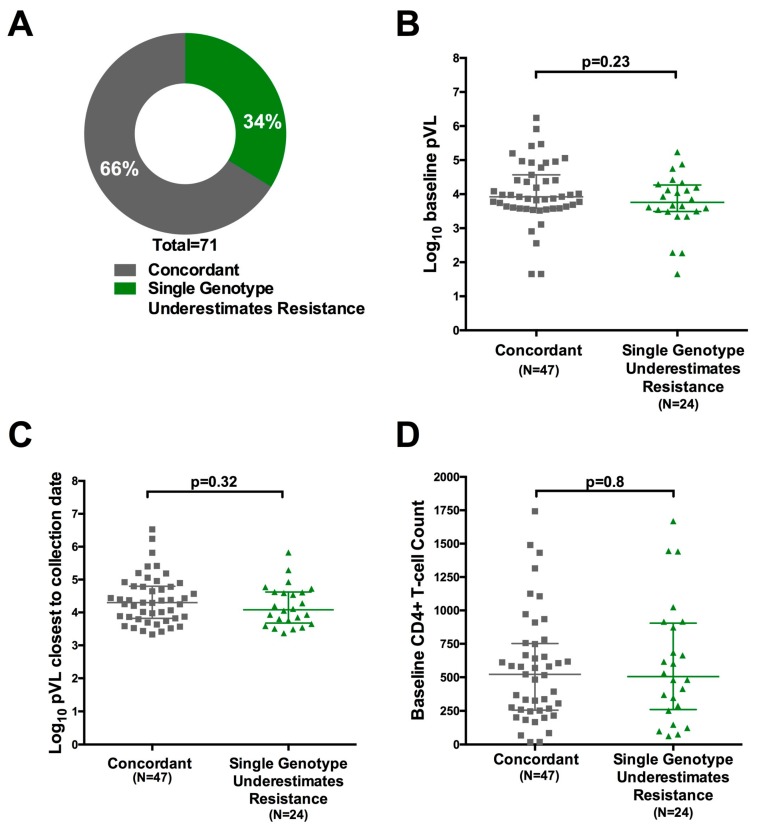
Figure 5.
Impact of replicate genotyping on resistance interpretation: (A) Proportion of individuals for whom all replicate resistance genotypes were concordant at the individual drug level (grey) versus those where interpretation based on a single genotype would have underestimated the degree of resistance (green). Analysis was based on 71 participants for whom at least two replicate genotypes, derived from any amplification type, were available; (B) Log10 baseline plasma viral load of participants for whom all replicate resistance genotypes were concordant (grey) versus discordant (green) at the individual drug level; (C) Same as (B); but for log10 plasma viral load at failure (D) same as (B), but for CD4+ T-cell count at baseline.

