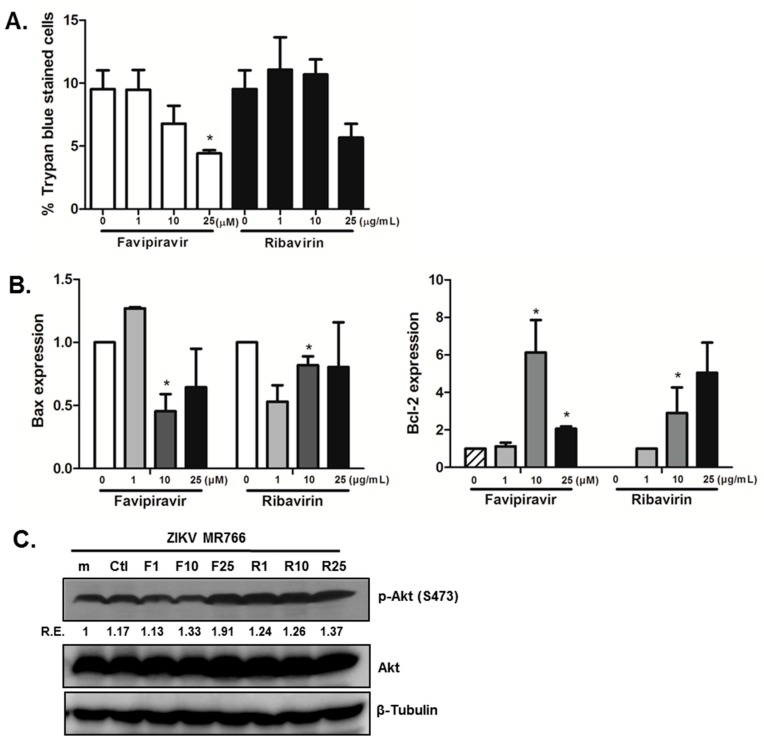
Figure 6.
Favipiravir treatment in hNPCs results in the reduction of ZIKV-induced neuronal cell death. (A) Trypan blue staining was performed and the graph represents the proportion of cells with positive staining. The averages of three independent experiments are shown. * p < 0.05. (B) BCL2 and BAX mRNA expression was measured by qRT-PCR. The expression of target genes was normalized to GAPDH. Data are shown as the means ± SEM from three independent experiments. * p < 0.05 compared with DMSO control-treated cells. (C) Phosphorylation of AKT was detected by western blot analysis using a specific antibody, with normalized densitometric units plotted against treatment (shown as numbers). The representative image of three independent experiments is shown. m(mock), Ctl (DMSO control), F (favipiravir), R (ribavirin), R.E. (Relative Expression).

