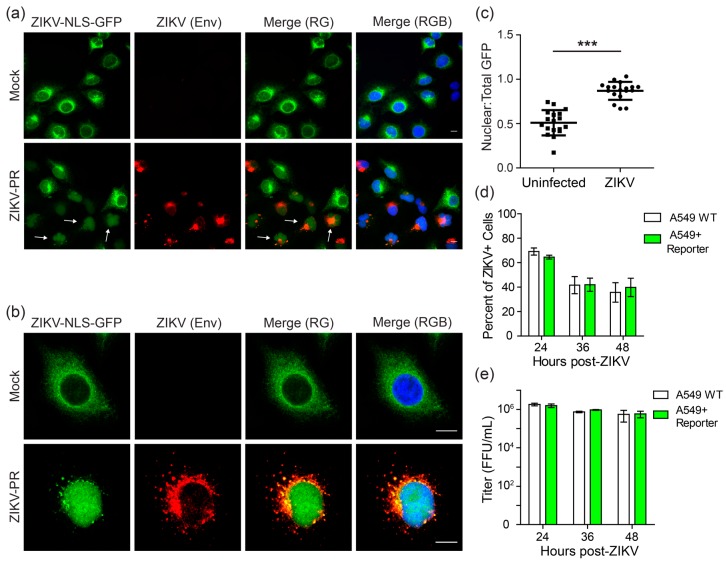
Figure 2.
The cleavable ZIKV-NLS-GFP reporter can detect ZIKV infection. (a,b) Fluorescence (a), or confocal micrographs (b) of A549 cells stably expressing the ZIKV-NLS-GFP reporter (green) that were infected with ZIKV-PR (multiplicity of infection (MOI) 1) or mock for 48 h and then immunostained for ZIKV (anti-Envelope (Env); red). Nuclei were stained with DAPI (blue). Scale bar, 10 µm. Arrowheads in the bottom panel of (a) indicate some representative cells staining positive for ZIKV with nuclear GFP localization. (c) The ratio of nuclear to total fluorescence intensity, as determined using Image J, in uninfected and ZIKV-infected cells from confocal micrographs of cells immunostained for ZIKV. Each dot represents an individual cell (n = 18). Dot plots represent the mean ± SD. Asterisks denote significance; *** p < 0.0001, as determined by an unpaired t-test. (d) Fields were captured at various time points post-infection with ZIKV-PR (MOI 10) of A549 cells (WT or stably expressed ZIKV-NLS-GFP) immunostained for ZIKV Env and nuclei (DAPI), and the percentage of ZIKV+ cells was calculated. Values represent the mean ± standard error of the mean (SEM) (n = 3 fields) from three independent experiments, with >3000 cells counted per field. (e) Supernatants from A549 cells (WT or stably expressed ZIKV-NLS-GFP) were harvested at 24, 36, and 48 h post-infection with ZIKV-PR (MOI 10) and viral titer was measured by focus forming assay. Values represent the mean ± standard deviation (SD) (n = 3) from one experiment, representative of two independent experiments.

