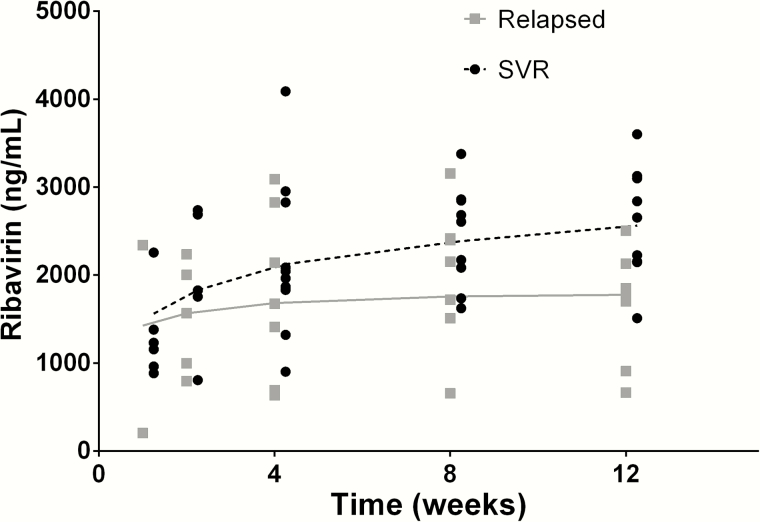
Figure 3.
Ribavirin concentrations in participants who achieved sustained virologic response (SVR; black) vs those who experienced viral relapse (gray). Ribavirin concentration (in nanogram per milliliter) is shown on the y-axis and time on study (in weeks) is shown on the x-axis. The median (interquartile range) ribavirin concentration in those who achieved SVR was 2655 (2156–3101) ng/mL vs 1745 (908–2131) ng/mL in those who relapsed, P = .01. Smooth lines of the ribavirin concentrations are shown (dashed for SVR, solid for relapse). Abbreviation: SVR, sustained virologic response.

