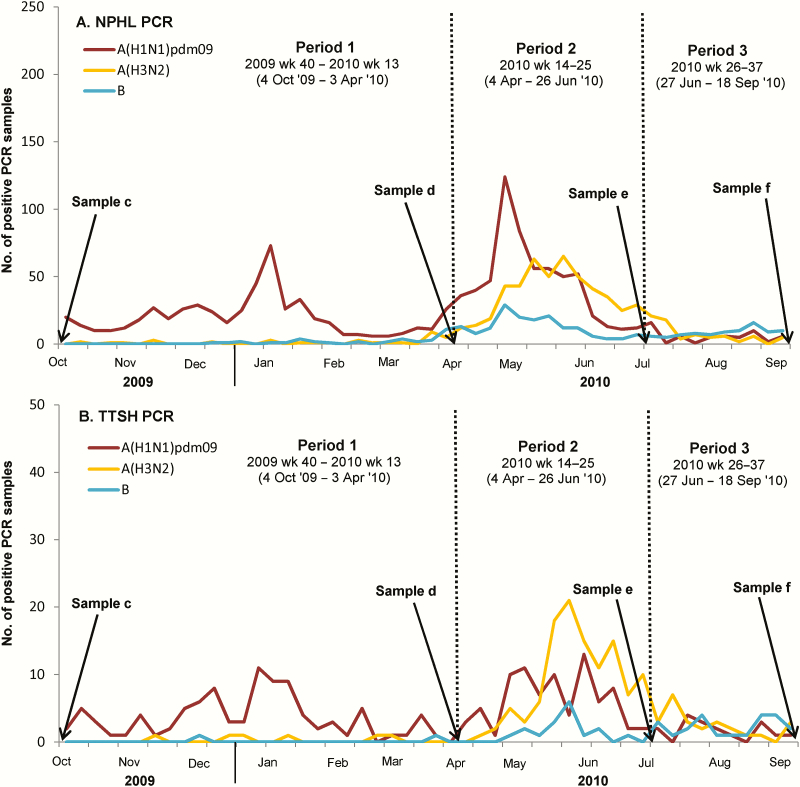
Figure 1.
A, Time course of serological analyses and polymerase chain reaction (PCR)–positive influenza cases detected by the National Public Health Laboratory (NPHL) surveillance system. B, Admissions to Tan Tock Seng Hospital (TTSH). Line graph denotes the weekly number of A(H1N1)pdm09 (brown–red), A(H3N2) (yellow), and influenza B (blue) PCR-positive cases among influenza-like illness samples submitted by general practitioners and polyclinics to the NPHL or from TTSH hospital. Sample a: 29 June 2005–27 June 2009; mostly banked samples from prior participation in the multi-ethnic cohort; not shown in figure. Sample b: 20 August 2009–29 August 2009; 3–4 weeks after the first peak of the pandemic; not shown in figure. Sample c: 6 October 2009–11 October 2009; 3–4 weeks after the first period of H1N1pdm09 epidemic activity had subsided. Sample d: 8 April 2010–22 April 2010; before the month of May, the most common influenza epidemic period in Singapore, and after the second most common epidemic period (typically between December and February [26]). Sample e: 2 July 2010–8 July 2010; 10–12 weeks after sample d. Sample f: 19 September 2010–27 September 2010; 10–12 weeks after sample e. Abbreviations: PHL, National Public Health Laboratory; PCR, polymerase chain reaction; TTSH, Tan Tock Seng Hospital.

