Figure 1.

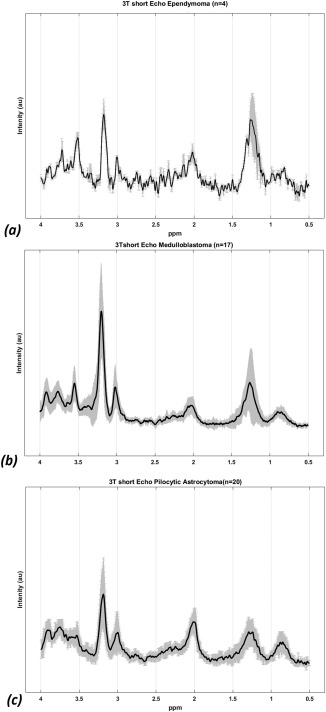
Mean 3T short time echo spectra for (a) ependymoma (n = 4), (b) medulloblastoma (n = 17), and (c) pilocytic astrocytoma (n = 20) with solid black line indicating the mean spectra and SD indicated by the shaded region.

Mean 3T short time echo spectra for (a) ependymoma (n = 4), (b) medulloblastoma (n = 17), and (c) pilocytic astrocytoma (n = 20) with solid black line indicating the mean spectra and SD indicated by the shaded region.