Figure 2.

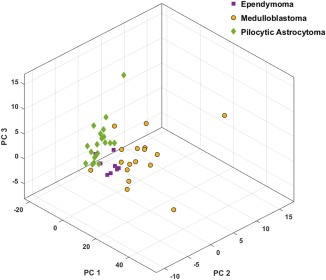
3D scatter plot presents principal component analysis (PCA) space for the discrimination of medulloblastoma (MB), pilocytic astrocytoma (PA), and ependymoma (EP).

3D scatter plot presents principal component analysis (PCA) space for the discrimination of medulloblastoma (MB), pilocytic astrocytoma (PA), and ependymoma (EP).