Figure 3.

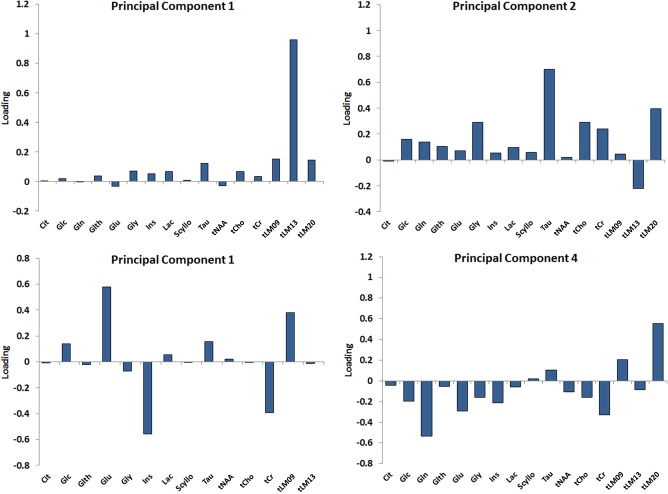
The Bar plot represents the PCA loadings of the metabolite sets for the main principal components demonstrating how the principal components are loaded with the metabolites features.

The Bar plot represents the PCA loadings of the metabolite sets for the main principal components demonstrating how the principal components are loaded with the metabolites features.