Figure 4.

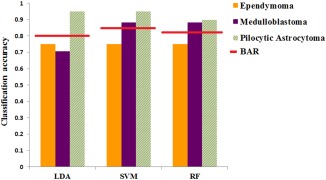
Bar plots represent individual tumor group classification accuracy along with their balanced accuracy comparing performance of the pattern recognition techniques.

Bar plots represent individual tumor group classification accuracy along with their balanced accuracy comparing performance of the pattern recognition techniques.