Figure 6.

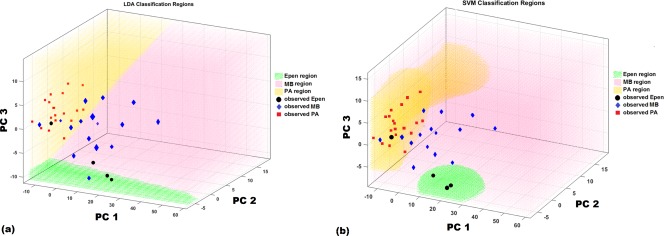
Three‐dimensional scatter plot shows the data clustering for the different tumor types with (a) LDA and (b) SVM decision boundaries. The graph is oriented so that each clustering can be seen form the best angle with a clear boundary.

Three‐dimensional scatter plot shows the data clustering for the different tumor types with (a) LDA and (b) SVM decision boundaries. The graph is oriented so that each clustering can be seen form the best angle with a clear boundary.