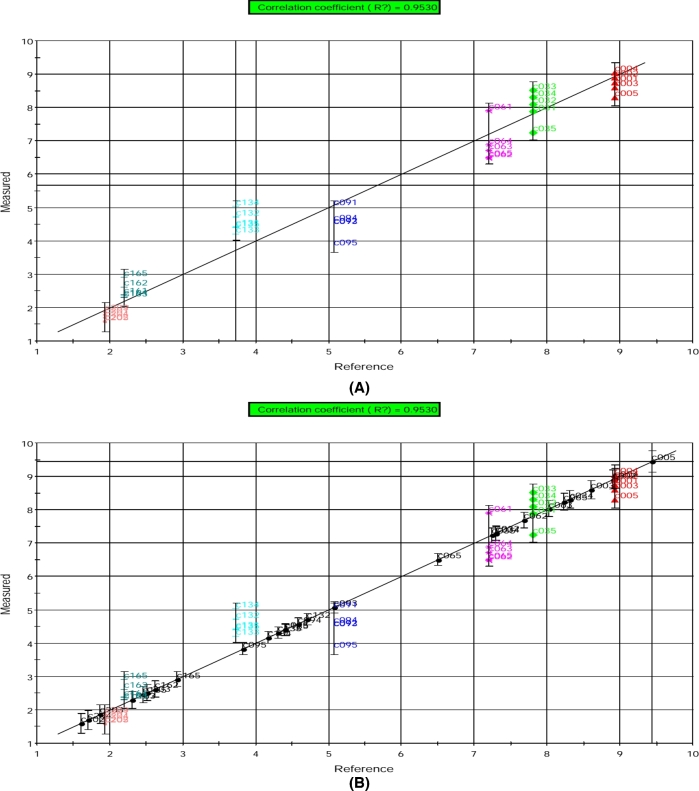
Figure 10.
PLS model results for the prediction of overall acceptability scores based on electronic nose data obtained from (A) calibration and (B) validation egg yolk samples. The prediction is shown as measured (predicted by e-nose) vs. reference (measured by conventional method) overall acceptability scores. Individual symbols indicate replicate samples taken at different storage time. C00 = d 0, C03 = d 3, C06 = d 6, C09 = d 9, C13 = d 13, C16 = d 16, and C20 = d 20.

